

 A motion chart is a dynamic chart to explore several indicators over time.
In this blog, we will demonstrate how to use a motion chart to illustrate student page view activities over time, in an attempt to examine whether there is a pattern between indicators, such as cumulative_page_views and a given date. The chart used in this blog was built with user-in-a-course-level participation data that Canvas (Learning Management System) collects: The data was harvested using the API endpoint that Canvas provides: /api/v1/courses/:course_id/analytics/users/:student_id/activity. An example of using a ruby script to gather student page view activity data is available at: github/jingmayer/garden
First, let’s prepare the data set and include the following fields:
- datetime: The date and time when a student accessed a Canvas course
- user: The unique user_id for a student
- pageview_id: The unique identifier for the data set, which is composed of an user_id and the hour of the day when a page view record was created by the user.
- cumulative_page_views: The accumulated/aggregated count of page views for a student on a given date
- daily_page_views: The actual daily count of page views for a student on a given date
- total_activity_time: The total activity time that a student spent in a course when the time the data was pulled
After the data is prepared, you can build a motion chart using the data in R with googleVis package.
You may switch the options for x-axis, y-axis, color and size to observe the page view activities from a different perspective. For instance, you may switch the Color option from ‘datetime’ to ‘user’ to observe the page_view activities for the same users over time.
In our example, the y-axis corresponds to the incremental page_views accumulated for an individual up to a given date, the x-axis denotes daily page_views, and the size of each point indicates the total_activity_time (in seconds) that an individual spent in the course. Each point corresponds to an unique pageview_id, which contains two parts: The user and the hour of the day the record was created.
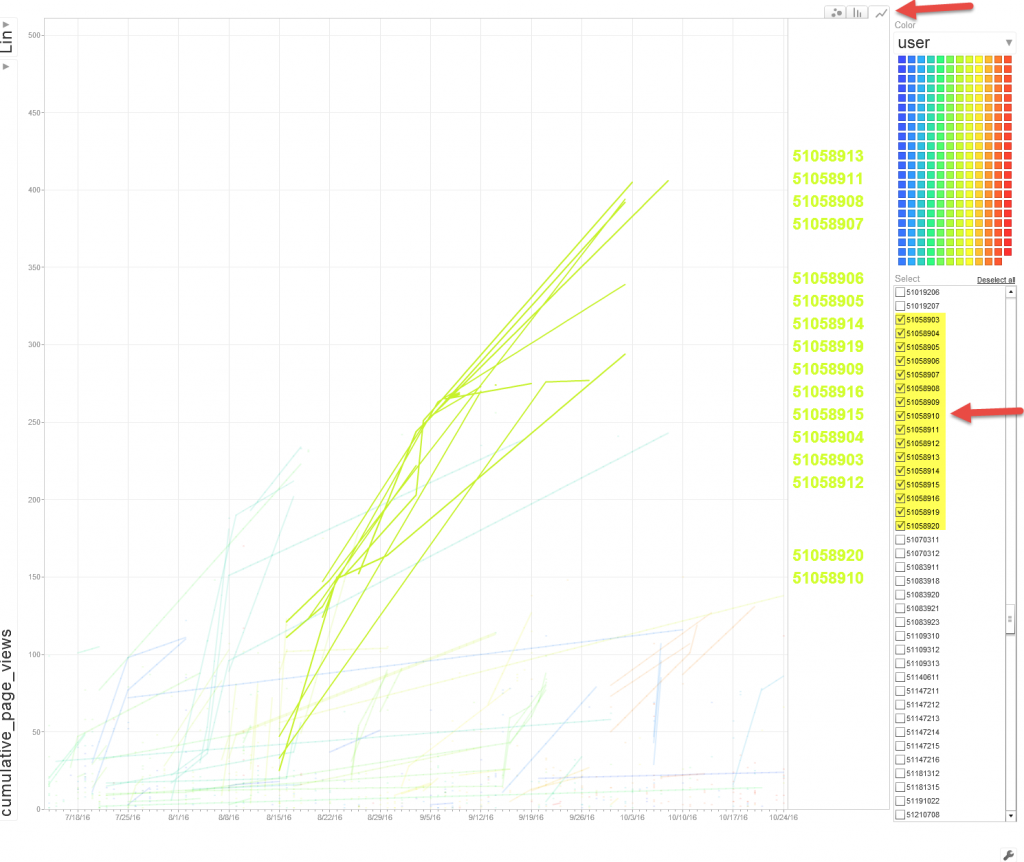
For instance, I would like to identify some self-motivated participants in a course, as I was playing the motion chart, I noticed that user ‘5105899’ had accessed the course and views many pages on a number of days. The screenshot of a motion chart below demonstrates: The point, marked as ‘510589911’, represents user ‘5105899’ viewed 10 pages at 11:00am on Oct.1, 2016, and by 11:00am on Oct.1, the user ‘5105899’ viewed 394 pages in total. The information shows that user ‘510589’ (the greenish points) accessed the course and viewed a number of pages on Oct.1, 2016 (circled in green). The user ‘510589’ generated the highest number of cumulative_page_views compare to his/her peers who also accessed the course on that day. 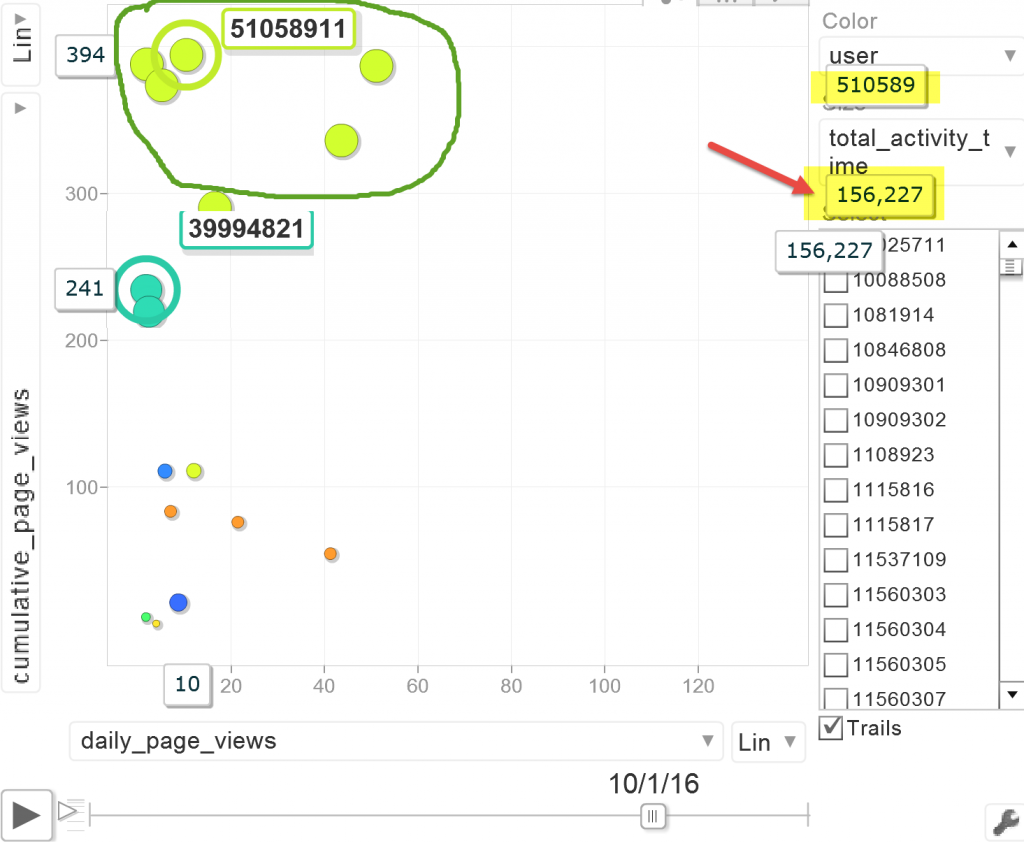 Furthermore, I am curious to see what the page view activities for self-motivated participants, such as user ‘5105899’, look like over time, did they access the course on a regular basis? Did they spend similar amount of time in the course? You may switch the motion graph type (iconType: Bubble, Bar and Line) to gain a different perspective on the same set of data.
 Reference: