

Treemap is a visual representation of a data tree, where each node is displayed as a rectangle, sized and colored according to values that you assign. Size and color dimensions correspond to node value relative to all other nodes in the graph. (https://developers.google.com/chart/interactive/docs/gallery/treemap)
When your data has a nested/tree relationship, a treemap can be an efficient way of presenting your data. The reason being is that when the color and size dimensions are correlated within a data tree, one can often easily identify patterns that would be difficult to spot otherwise. “A second advantage of using interactive treemaps is that, by construction, they make efficient use of space. As a result, they can legibly display many items simultaneously.” (https://en.wikipedia.org/wiki/Treemapping)
For instance, we can use two charts to present two sets of data that have a ‘tree’ or hierarchical relationship.
| chart one – parent nodes | chart two – child nodes |
|---|---|
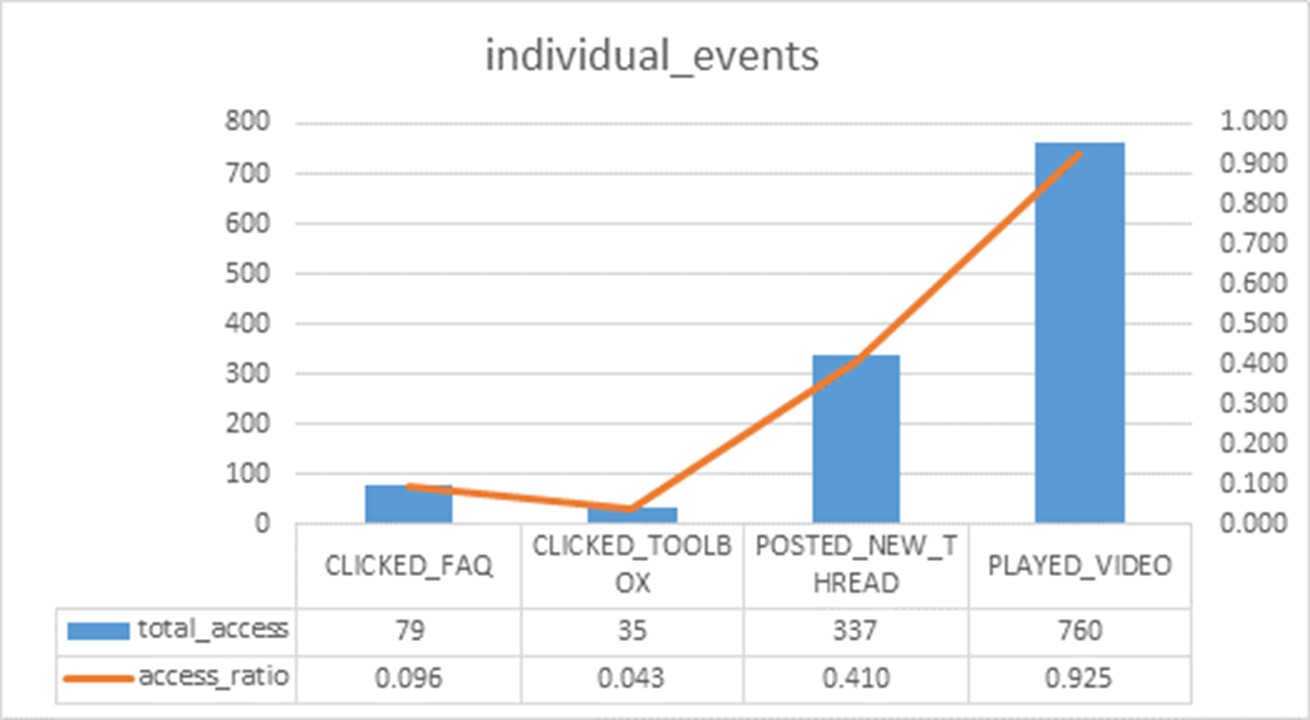 |
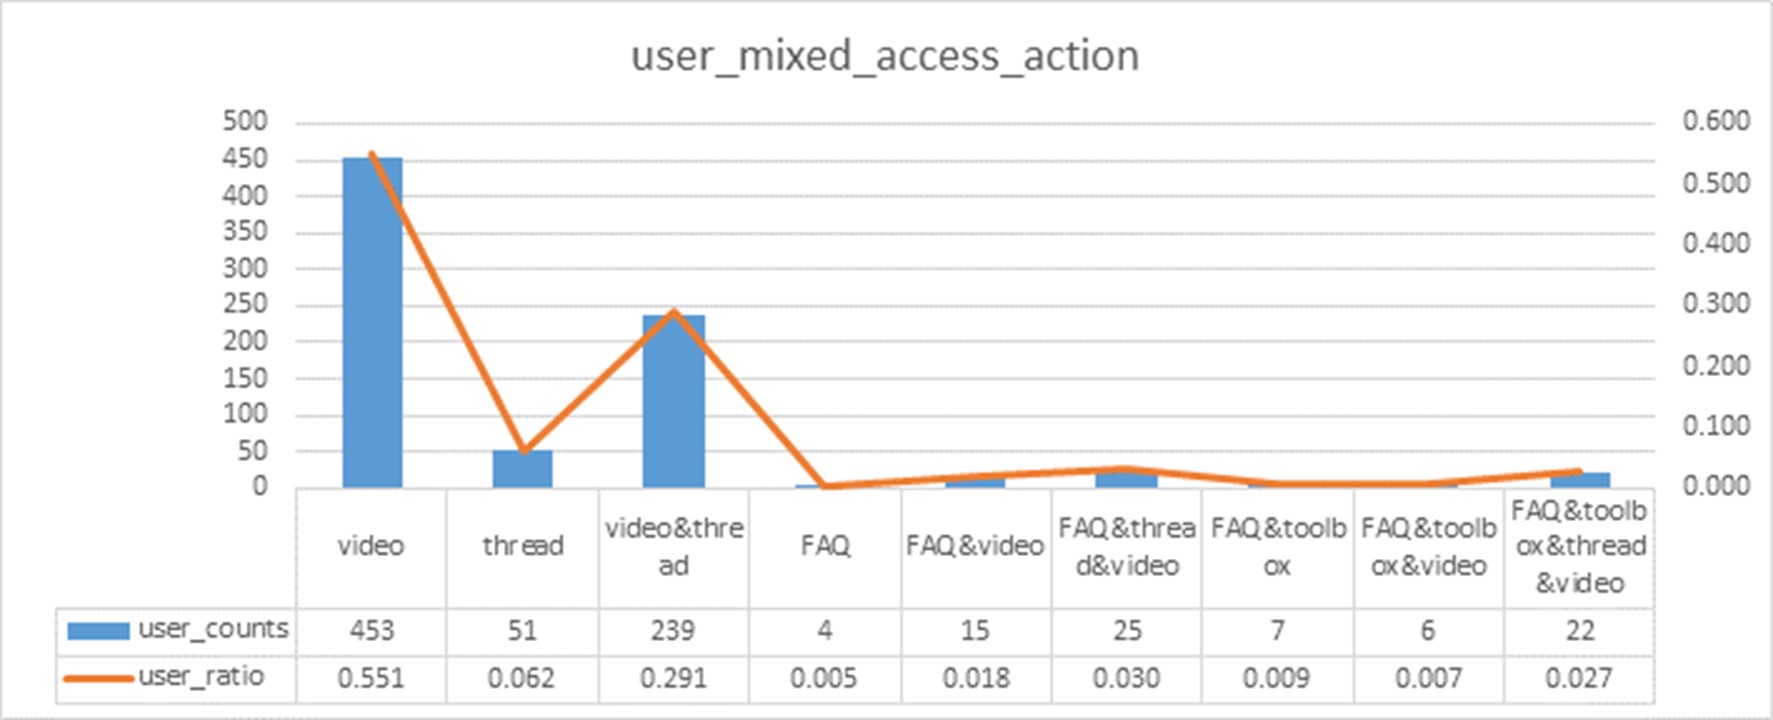 |
We can combine the two sets data and use treemap to visualize the data tree in nested rectangles.
Below, I include two treemap visualizations for the same data tree. In comparison to treemap one, treemap two makes elements highlight when moused over, and set specific colors for certain elements to use when this occurs.
| treemap one – nested | treemap two – hightlights |
|---|---|
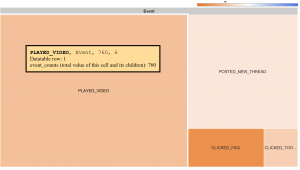 |
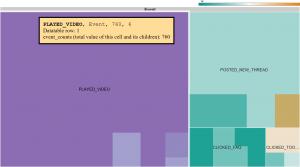 |
This above treemap graph allows me to more easily spot a pattern than using the two bar charts to identify:
- Among the users who posted discussion threads, they are likely to watch videos as well
- Among the users who clicked on FAQ, they tend to participate other activities as well
Another more complex example is available at https://jqi.host.dartmouth.edu/1176treemap.html
- The root level represents the level of completion status relative to all the nodes
- The first nested nodes correspond to individual participants who went through certain percentage of the course modules
- the second nested nodes correspond to the individual pageview activities