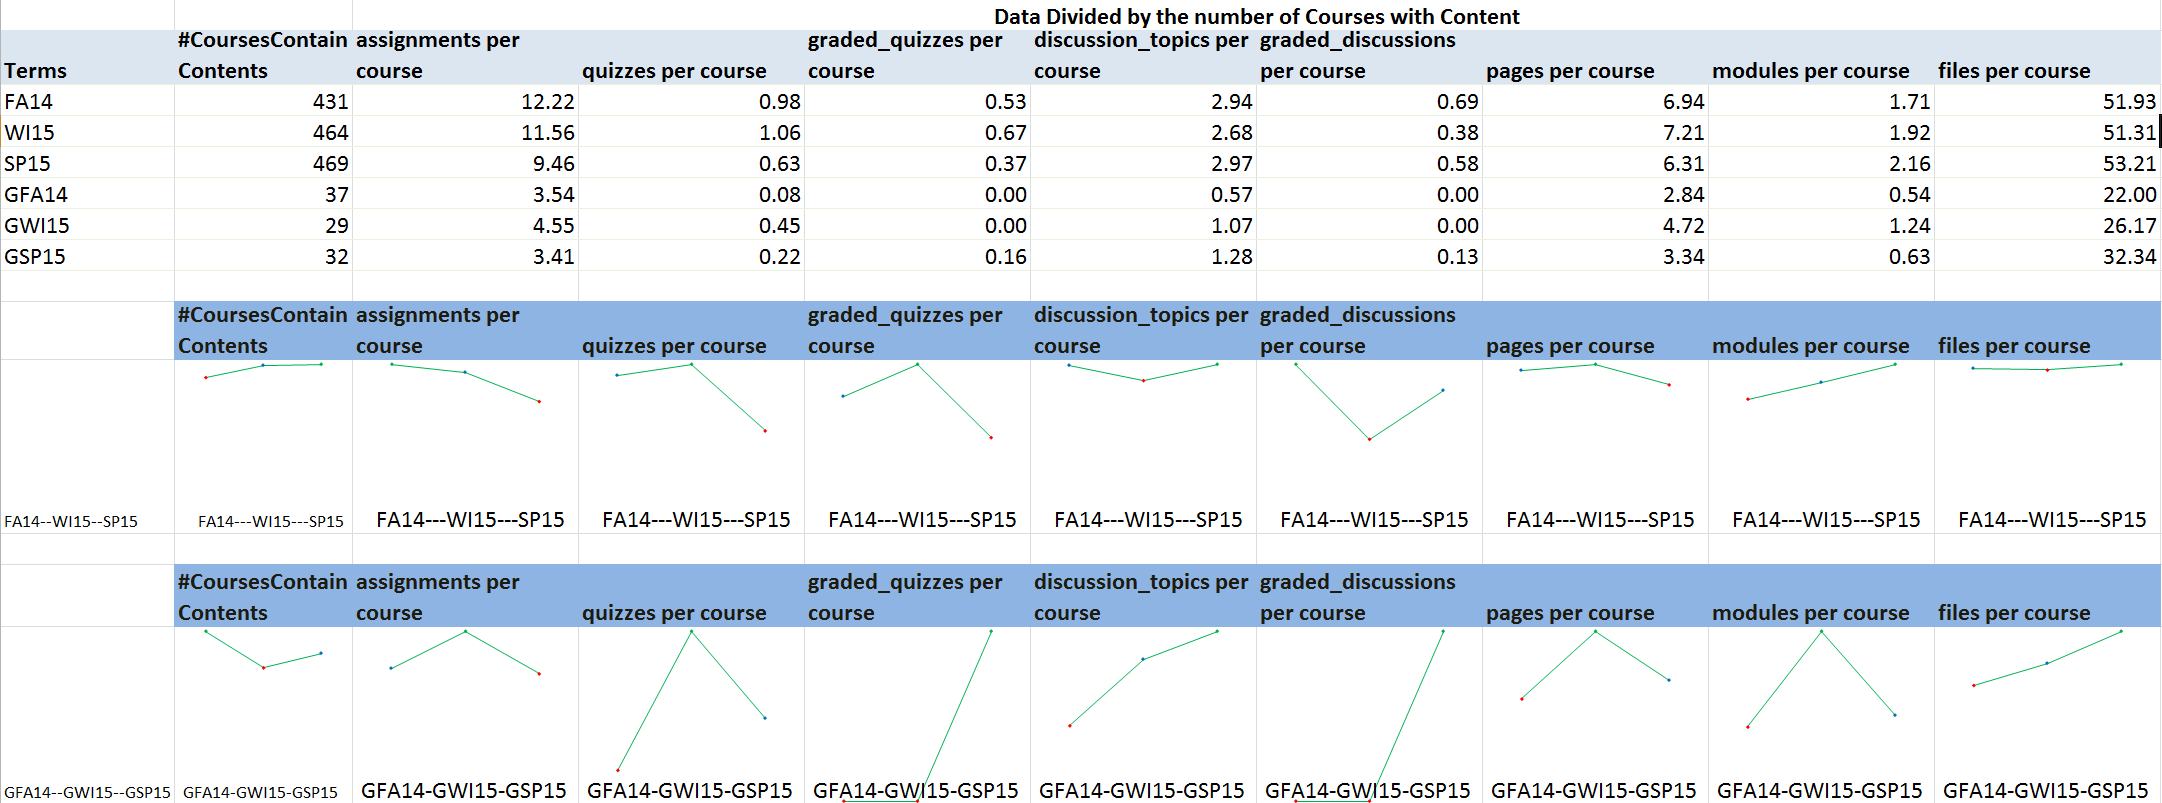
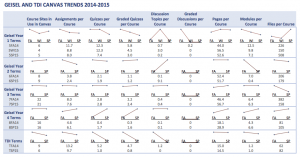
By Winter 2015, Dartmouth completely transitioned out of Blackboard, and began using Canvas as its primary LMS. We are interested in learning how Canvas has been utilized as an extension to face-to-face learning experience. The following chart suggests:
- A&S undergraduate and graduate level courses show different changes over the three terms,
- more SP15 undergraduate level courses adopted module-based design compared to WI15 term,
- compare to WI15, fewer SP15 graduate level courses used either page or module to deliver content, in contrast, graduate level courses tend to use Canvas to administer more quizzes and facilitate more discussions,
- among A&S undergraduate level courses, the chart reveals that as the number of published Canvas courses grows, the average number of assignments per course goes down.
We plan on consistently collecting similar set of descriptive data, and comparing the results to examine whether and how the pattern evolves over time. We are also in the process of gathering more data for diagnostic analysis in an attempt to identify elements that contributed to the changes.

Changes in Canvas course content over terms
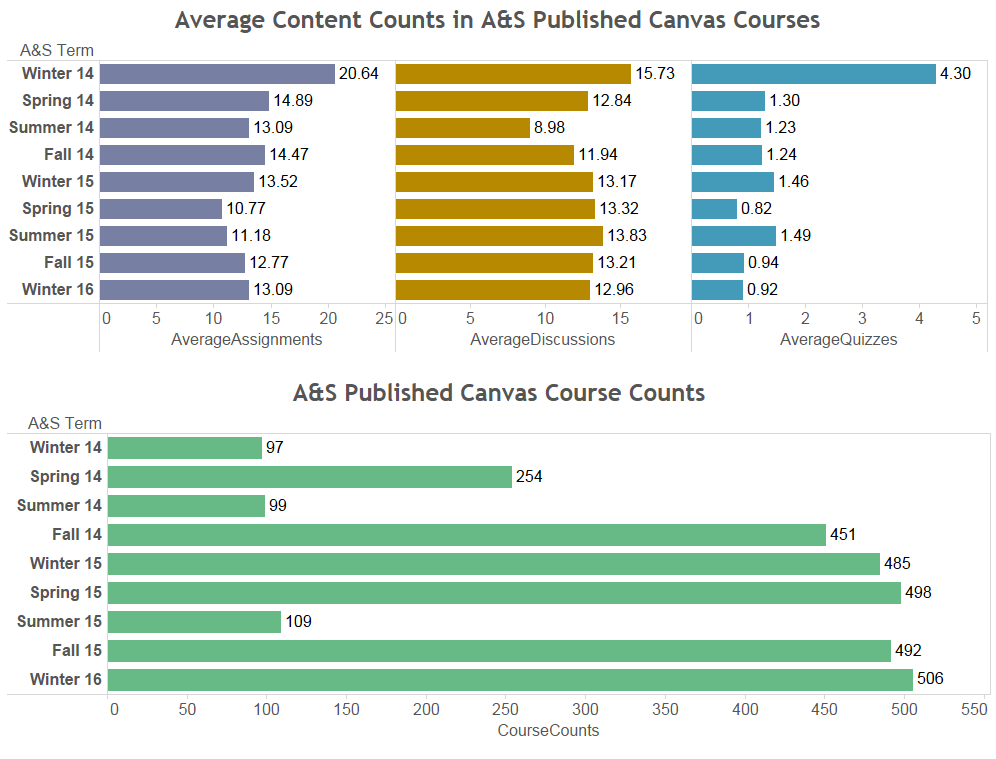
Average counts of course contents (Assignments, Quiz and Discussion) by terms:


