

This blog is a continuation of the previous blog:
In previous blog, we introduced the method to calculate the point-biserial value from students’ quiz submissions that were derived from three instances of the same course. The same course was offered in three consecutive terms: Spring 2013, Spring 2014 and Spring 2015. In the following texts, the three courses will be noted as SP13, SP14, SP15 respectively.
In this blog, we intend to demonstrate an application of the quiz statistics.
- The point-biserial correlation coefficient derived from students’ first attempts on all quizzes reveal two quizzes that contain question items yield a high point-biserial value (greater than .5); we’ll label these as “Quiz 1” and “Quiz 2”. Quiz 1 contains four questions worth 1 point each, whereas Quiz 2 contains five questions, worth 1 point each. The point-biserial correlation coefficient measures how well a single question can tell the difference (or discriminate) between students who do well on an exam and those who do not.
- In general, students participate in repeated practice to get a full score on the quizzes that allow multiple attempts. And quite a small number of students continue practicing after they get a full score. For instance, for Quiz 1, among 46 students who got a perfect score on their first attempt, only one student made second attempt; Among 61 students who got a full score on their second attempt, only 3 students took Quiz 1 the third time. The two
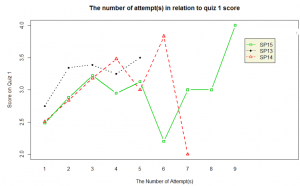 graphs below show the average quiz score in relation to the attempt taken. We observe that after the 4th attempt, student scoring becomes somewhat random, which is quite likely due to fatigue/saturation
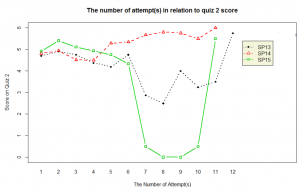 .
.


For the few students who continued practicing after achieved a full score, they probably re-take the quiz for the sake of practice and care less about the score, or they might access the quiz primarily to review the embedded videos.
- Our further analysis on these two highly discriminating quizzes, Quiz 1 and Quiz 2, in the SP15 course indicates that students, who on their first attempt, receive a score of 1 (out of 4) on Quiz 1 and a score of 3 (out of 5) on Quiz 2, tend to perform poorly on the final exam.
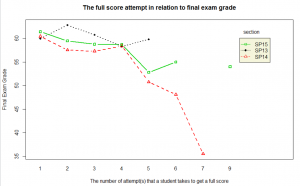
- There is an inverse relationship between the number of attempts that a student takes to get a full score on the quiz and the student’s final exam grade.
Implications:
- Quizzes 1 and 2 can be used to predict problematic student performance: If a student receives a score of 1 (out of 4) on the identified highly discriminating Quiz 1 and a score of 3 (out of 5) on Quiz 2, the instructor can be notified in order to take additional remedial measures. Early interventions and extra help need to be employed in order for the identified students to make sufficient progress on the subsequent course content.
- Furthermore, if a student struggles to receive a full score on the quizzes by the 4th attempt, similar interventions are suggested.
Recommendations:
- In order to leverage quiz statistics to predict student course outcomes , we suggest that faculty who employ low-stakes quizzes embed one or two multiple choice question items into these quizzes so as to make them highly discriminating.
