

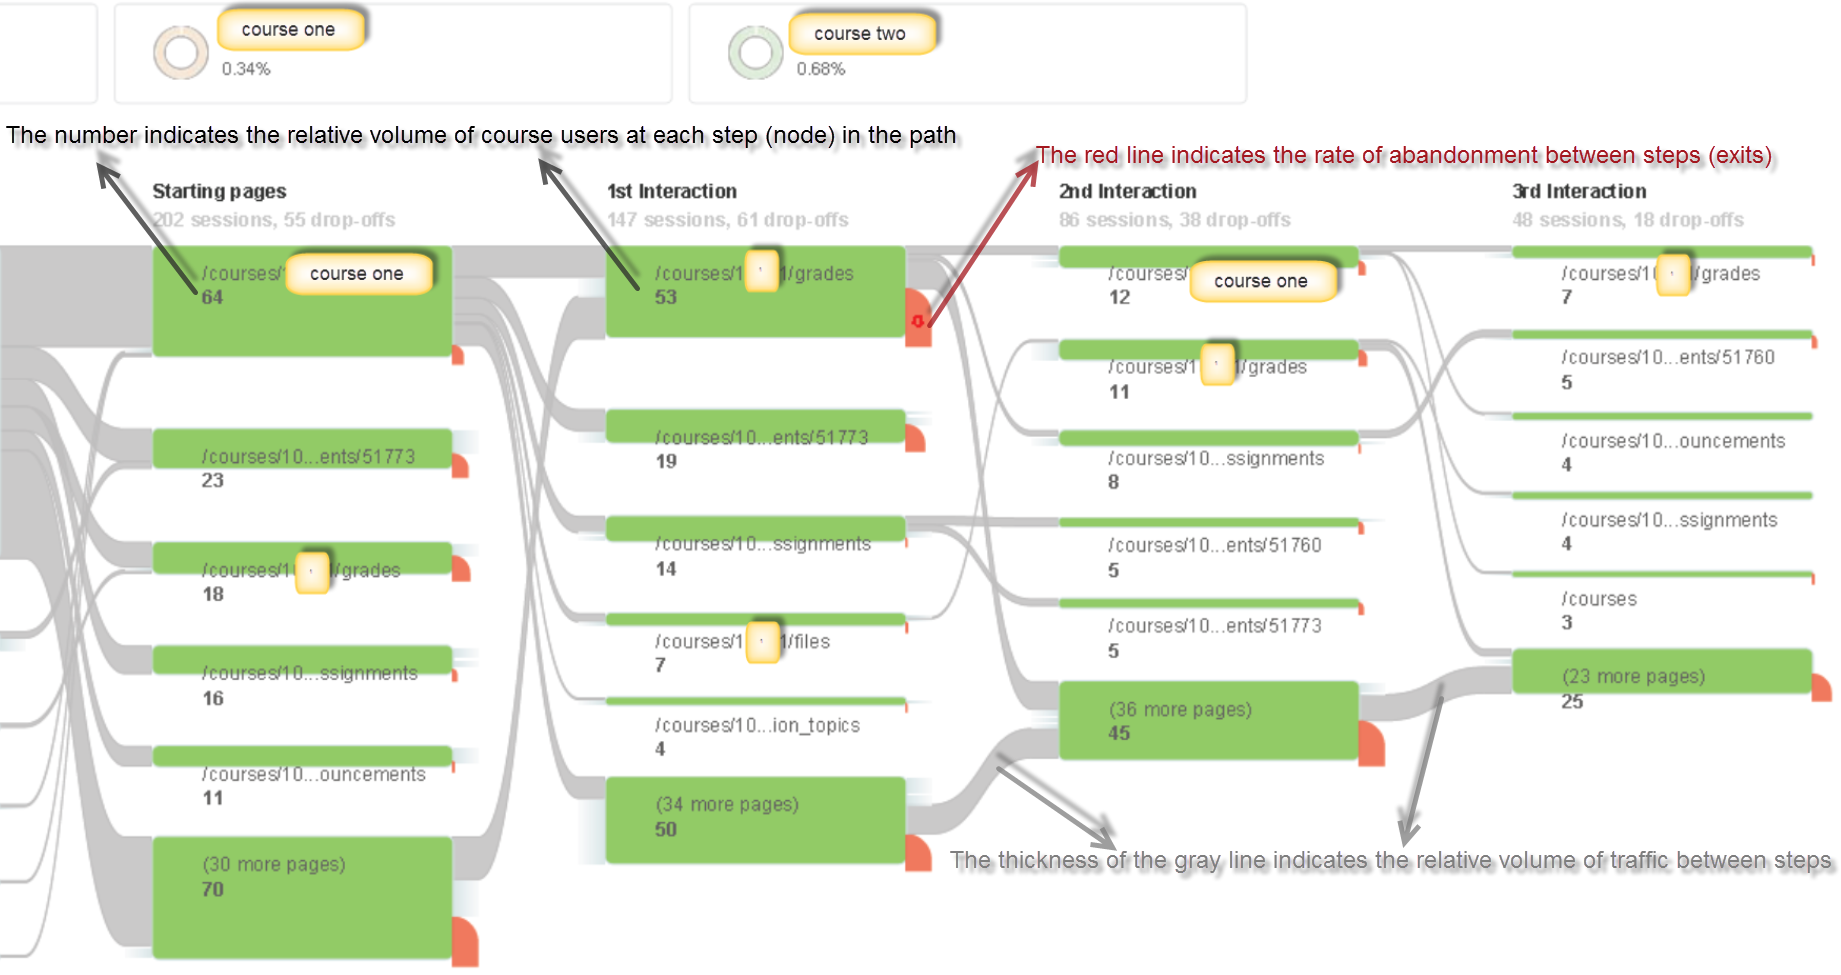
The Course Users Flow report is a graphical representation of the paths a course user took through a course site, from the landing page to the various pages, and where along their paths they exited the course site. The Course Users Flow report allows us to examine course user navigation flow patterns within a course site, and further to analyze the efficacy of a course site design. (https://support.google.com/analytics/answer/1709395)
We attempt to use the user flow report to examine how Canvas facilitates students final exam preparation. The following two course user flow charts illustrates navigation traffic patterns in two Canvas courses that adopted distinct design approaches:
- Course one primarily uses Canvas native Files and Assignments feature to deliver course materials, publish weekly homework, and collect student assignment submissions;
- Course two utilizes homepage to distribute weekly lecture notes and exam study guide materials, links classroom lecture video recording via echo360 integration and organizes class discussion via an external tool – Piazza.
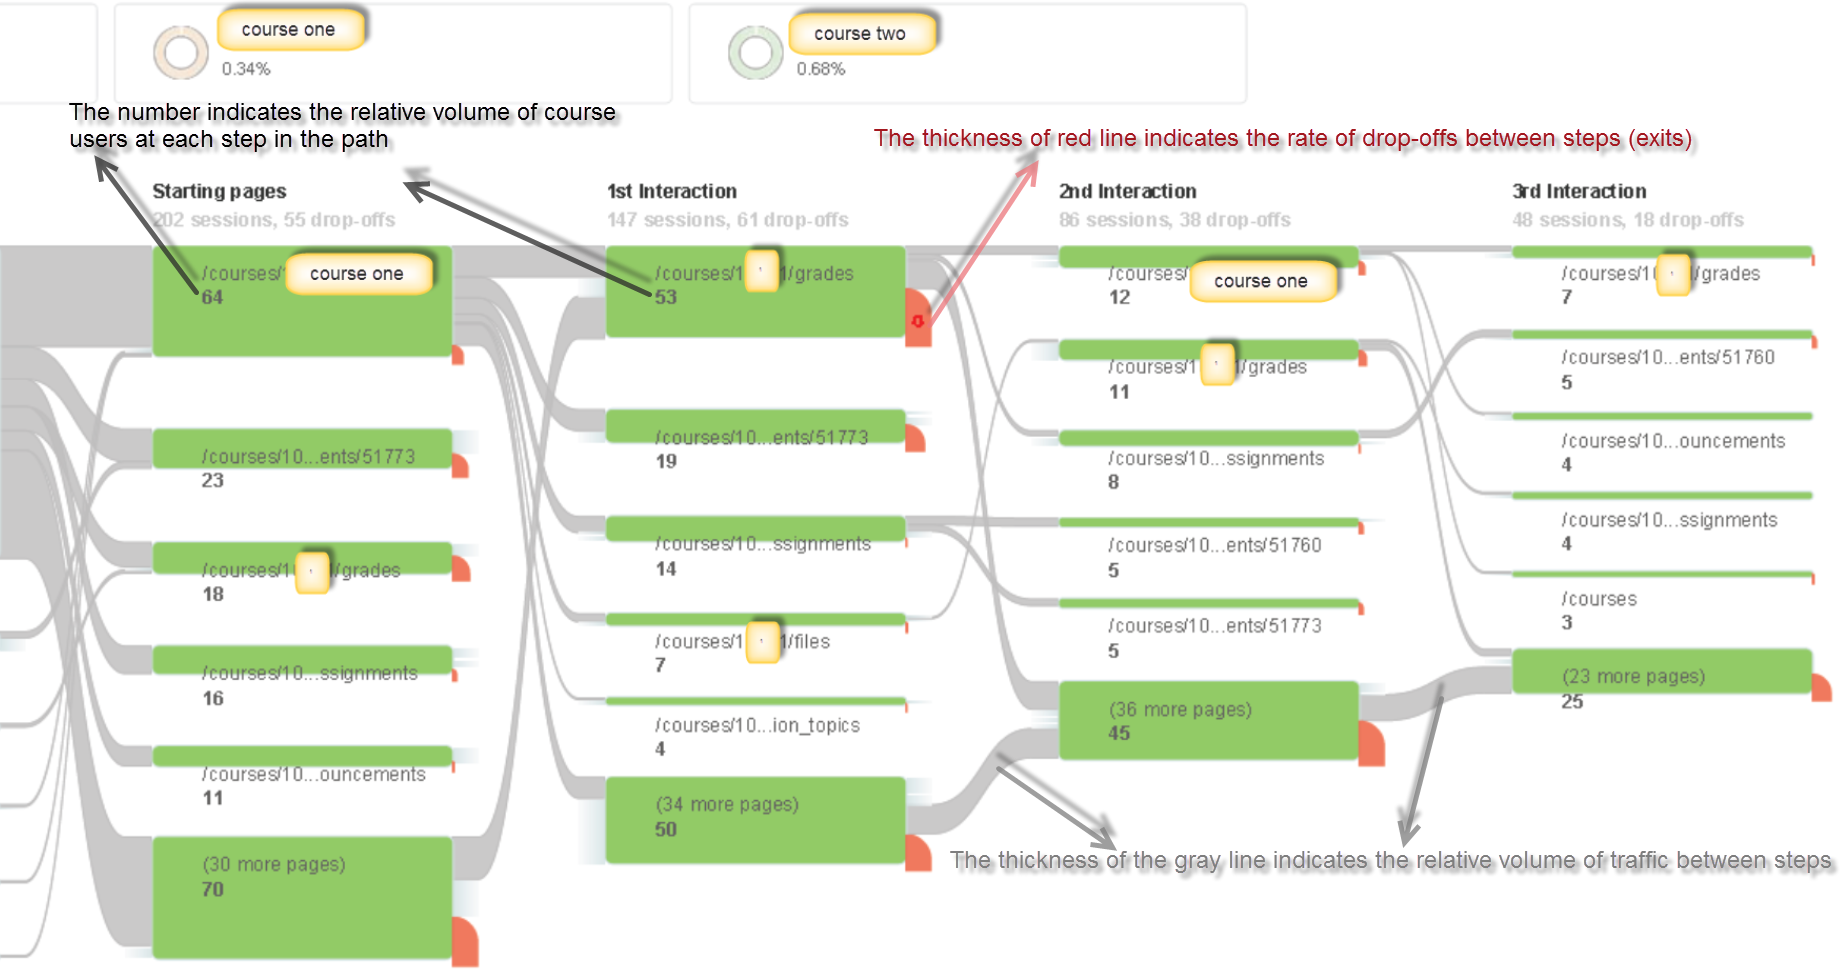
The course one user flow chart shows that checking course grade was the most popular path; while the user flow report for course two suggests that reviewing the class lecture video recording was the primary purpose of logging into the course site. From the level of engagement point of view, course two students were most engaged in taking final exam and reviewing the lecture captures, and in contrast, course one students were more engaged in checking their grades and taking the exam than accessing course files.