Student course access data can potentially help us identify effective course designs. We can leverage student click-stream data generated in LMS to examine the effectiveness of certain course designs.
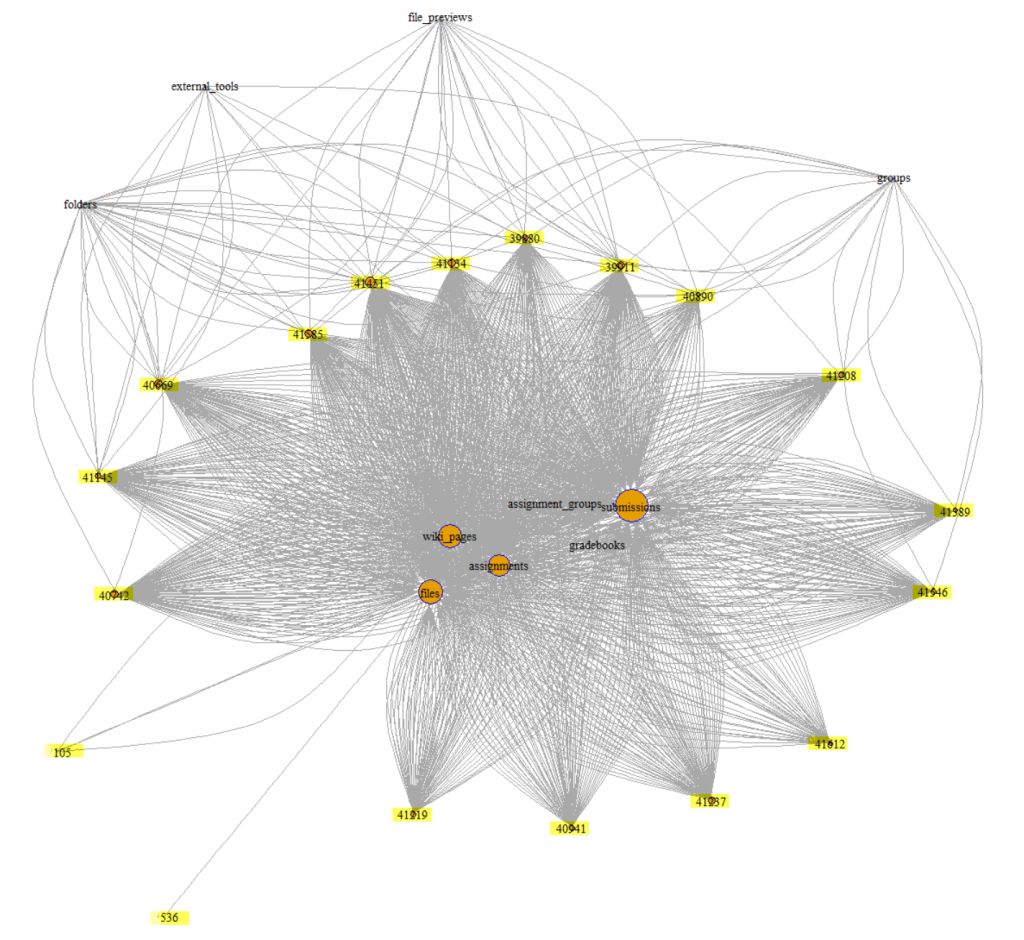
For instance, the following graph demonstrates student course content access pattern. The course we selected in this example employed a page-based design approach: Each weekly study guide is presented in an individual page layout, reading materials are embedded/linked in the weekly study guide descriptions, and students can also access the reading materials by directly going to the file repository.
When a student accessed a file directly via the file repository, ‘folders’ event was emitted; When a student click on a file embedded in the study guide content page, ‘files’ event was emitted if the student chose to download the file, and ‘file_previews’ was emitted if the student clicked to preview the document.
Graph 1: The nodes with number indicate students – student nodes, the nodes with texts indicate course contents – content nodes. The size of content nodes implies total access to certain content made by students, and the size of student nodes implies the quantity of clicks to all course contents initiated by the student.

Please note that the number associated with each student node was fabricated.
This graph allows faculty to easily identify the student who made fewer content access than others. Also the graph shows that students prefer downloading files instead of previewing them. Students tend to access files embedded in content area (study guide pages) rather than going to the file repository (Files tab) to navigate through course files.

