In previous blog, I mentioned about the application of Sankey diagram in course design, and included an example of course access flow chart that was built in Tableau.
In this blog, I built an user flow diagram in R using givsSankey package to visualize student action (participate or view) on assignments, for instance, quizzes and discussions.
In a self-paced open online course, I would like to find out the disparity in number of attempts between previewing a quiz and taking the quiz (clicked on submit button); And the difference in action between reviewing discussion threads and participating a discussion.
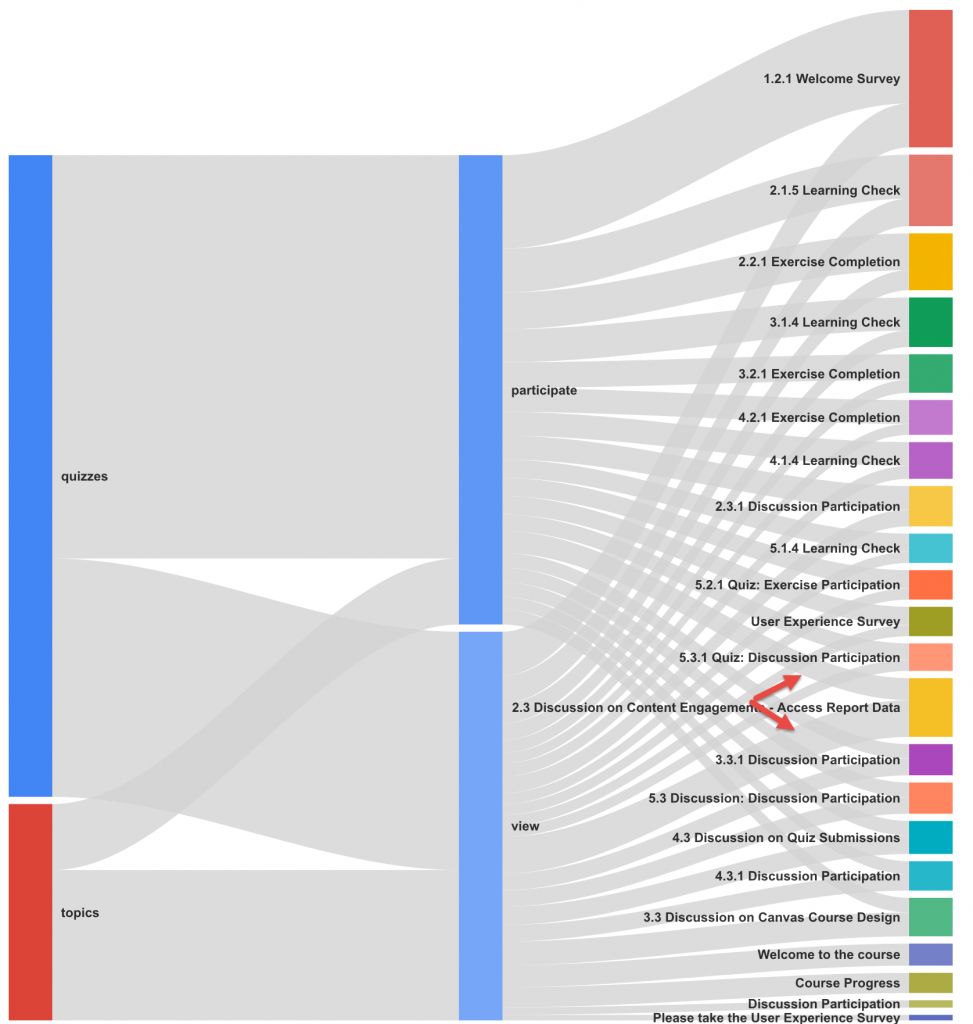
Student content access raw data was gathered and used to build a visualization. Below is the visualization of student actions on quizzes and discussions presented in a Sankey chart. The chart was built in R using givsSankey package.
Chart 1: The width of grey line indicates the total count of students who participated or viewed an object. The length of quizzes and topics bar represents the total count of students who took an action on the object. The length of each bar on the right denotes the total count of students who either participated or viewed the item.
The visualization suggests that for discussion topic-“Content Engagement” (where the red arrows point), students tend to click through a discussion page rather than posting or replying a thread, which prompted me to examine the topic description and rephrase it.
To build a graph like this, first, we need to prepare a file contains the elements that you would like to examine. In this example, I gathered user page_view data in an open online course that include the following fields, and saved it in a csv file format:
- UserID is the unique student id.
- Category includes the content and feature that a student viewed, like announcements, assignments, grades, home, modules, quizzes, roster, topics, and wiki.
- Class includes classification for each Category like announcement, assignment, attachment, discussion_topic, quizzes/quiz, etc.
- Title is the name of the content.
You must install the packages in R before use them, and you only need to do it once:
install.packages(googleVis)
install.packages(sqldf)
#Require/Call the packages
library(googleVis)
library(sqldf)
#Load the file
pageview=read.csv(“pageview.csv”, header=TRUE)
#Manipulate the data
Sankey <- sqldf(“select Category, Action, count(UserID) as Weight from pageview where (Class not in (”) and Category in (‘quizzes’,’topics’)) group by 1,2
UNION ALL
select Action, title, count(UserID) as Weight from edge where (Class not in (”) and Category in (‘quizzes’,’topics’)) group by 1,2″)
#Draw the diagram
plot(gvisSankey(Sankey, from=”Action”, to=”Category”, weight=”Weight”,
options=list(height=700, width=650,
sankey=”{
link:{color:{fill: ‘lightgray’, fillOpacity: 0.7}},
node:{nodePadding: 5, label:{fontSize: 9}, interactivity: true, width: 30},
}”)
)
)


