I’m the coordinator for Dartmouth’s Learning Fellows Program, a program that places advanced students in classrooms to help facilitate small group activities. Part of my job is to help Learning Fellows troubleshoot when small group activities don’t work as planned. Group work can help students navigate complex ideas, but it’s not easy to maintain dynamic communication between all members of a group. All kinds of communication concerns can arise during group work, from students who dominate conversations to students who don’t know how (or might not want) to participate in conversations. But often, the challenge lies somewhere in the middle of those two extremes. Students start conversations, and then the conversations peter out. A question I often get from our Fellows is “how can I keep momentum going?”
It’s the same problem we often see in online discussion boards. Students answer an initial question, and they might send a few responses to other student posts. But the responses tend to be superficial and there’s hardly ever a response to the response. There’s not really a lot of “discussing” going on. The discussion boards end up looking more like a collection of student reactions rather than a living conversation.
At Dartmouth, we’re trying to help tackle that problem with data. Our instructional designer Jing Qi has built an awesome new app that can filter key data from online discussion boards, then present a summary of that data in easily interpreted visualizations. Instructors (or coordinators like me!) can use the visualizations to help decide how to most effectively use discussions in their courses, and how they might be able to keep students talking to one another.
Let me back up just one step and say a little about why discussions are important. We know that intuitively. Discussions help students learn to communicate their ideas, to evaluate ideas, and to apply their skills to new contexts. But perhaps the reason I value discussions so highly – and group work more generally – is that discussions allow students to envision their future communities (behind a paywall). In discussions – whether in-class or online – students learn how they want to act in a community, and what kinds of communities they might be seeking. If we’re interested in training responsible, conscientious citizens, we need to provide our students with opportunities to act within communities. Discussions offer these opportunities.
“Discussions allow students to envision their future communities.”
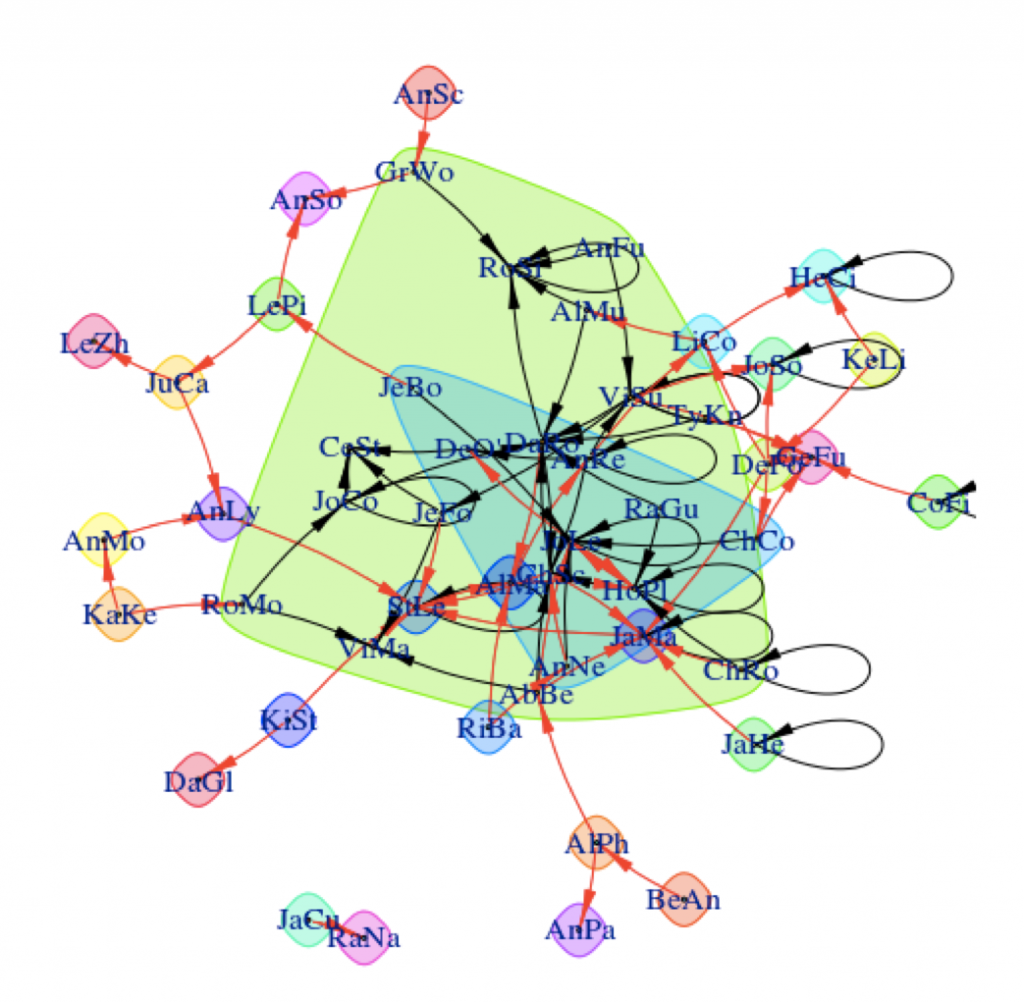
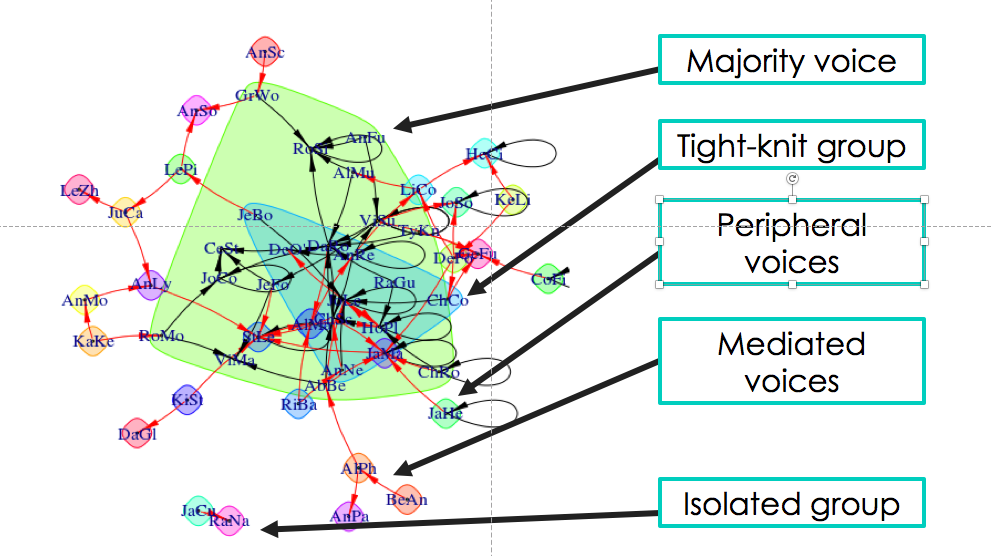
Jing Qi’s learning analytics app can help us understanding how communities are forming in classroom discussions and online discussion boards. Below is a sample visualization from her app. Don’t be alarmed! Once you input a simple data file, the visualization builds itself. It takes into account which students are posting and responding to one another and the length of their responses (we’ll come back to this in a later post). The visualization automatically calculates the connections between the students and shows each student as a four letter code. Connections are shown in arrows, where black arrows show intergroup connections and red arrows show intragroup connections. No arrow means there’s no connection between the students. Colored shapes surround the groups with the strongest communities.
If we digest this visualization a little bit, we can see several kinds of communities emerging from the discussion data. There’s a big green shape that surrounds the students I like to call the “majority voice.” It contains most of the students in the course. The other, small community in the blue shape I like to call the “tight-knit group.” These are students who frequently respond to one another, and they are a subset of the majority voice. Maybe they are friends, play on a sports team together, or have previously taken a course together. I can also see a few smaller communities in this visualization. Some are just individuals, located on the periphery of the majority voice and occasionally interacting with those students. Some are mediated voices, where students communicate with a student on the periphery who then communicates with the majority voice. And some communities are just two students, talking only with each other.
Let’s assume we want to change this scenario so that more students are interacting with one another. Maybe we want to include more of those voices on the periphery or break up the “tight-knit group.” Maybe we want to bring those isolated, two-student groups into the fold, because they might have very interesting and unusual ideas to contribute to the discussion. There’s a couple of strategies we could use to change the discussion dynamics. One strategy is “node-based,” and focused on the influence of the students in the center of the groups. Another is “composition-based,” which mixes and matches groups to encourage more diversity. Both strategies have their time and place.
My colleagues and I were fortunate enough to present on these strategies at a recent Canvas Live! presentation, where we were joined by members of Northwestern’s learning analytics team. In case you missed the session, I’m also going to post some of our take-aways on this blog. The next post will be on the “node-based” strategies and will feature some ideas from my colleague-in-arms Scott Millspaugh. He’s an instructional designer for Dartmouth’s Arts and Humanities division and one of the co-facilitators for our Digital Humanities initiative. Like me, he’s fascinating by the potential of data to transform the way instructors can make decisions about their courses. The last post in this series will feature some “composition-based” strategies, based on my own experiences with Dartmouth’s Learning Fellows. They’ve been important and insightful voices on our campus, reframing the way we think about discussions and community. I’m excited (and honored) to share their ideas with you. Look for our “node-based” approach this time next week, and our “community-based” approach soon to follow.
In the meantime, feel free to contact me with questions! Please use the comment box below!


