

When we employ solid approach for data analysis, the results derived from LMS access data can bring actionable insights, and help instructors identify how top performing and at-risk students do differently. By comparing the results between the two groups, instructors can potentially determine where at-risk students struggle, and tailor course materials to effectively help student prepare for exams.
In this blog, we will show an example of how content access analytics can inform the efficacy of course materials in relation to students’ performance. Furthermore, we will share ideas about how to leverage the results to make data-informed changes.
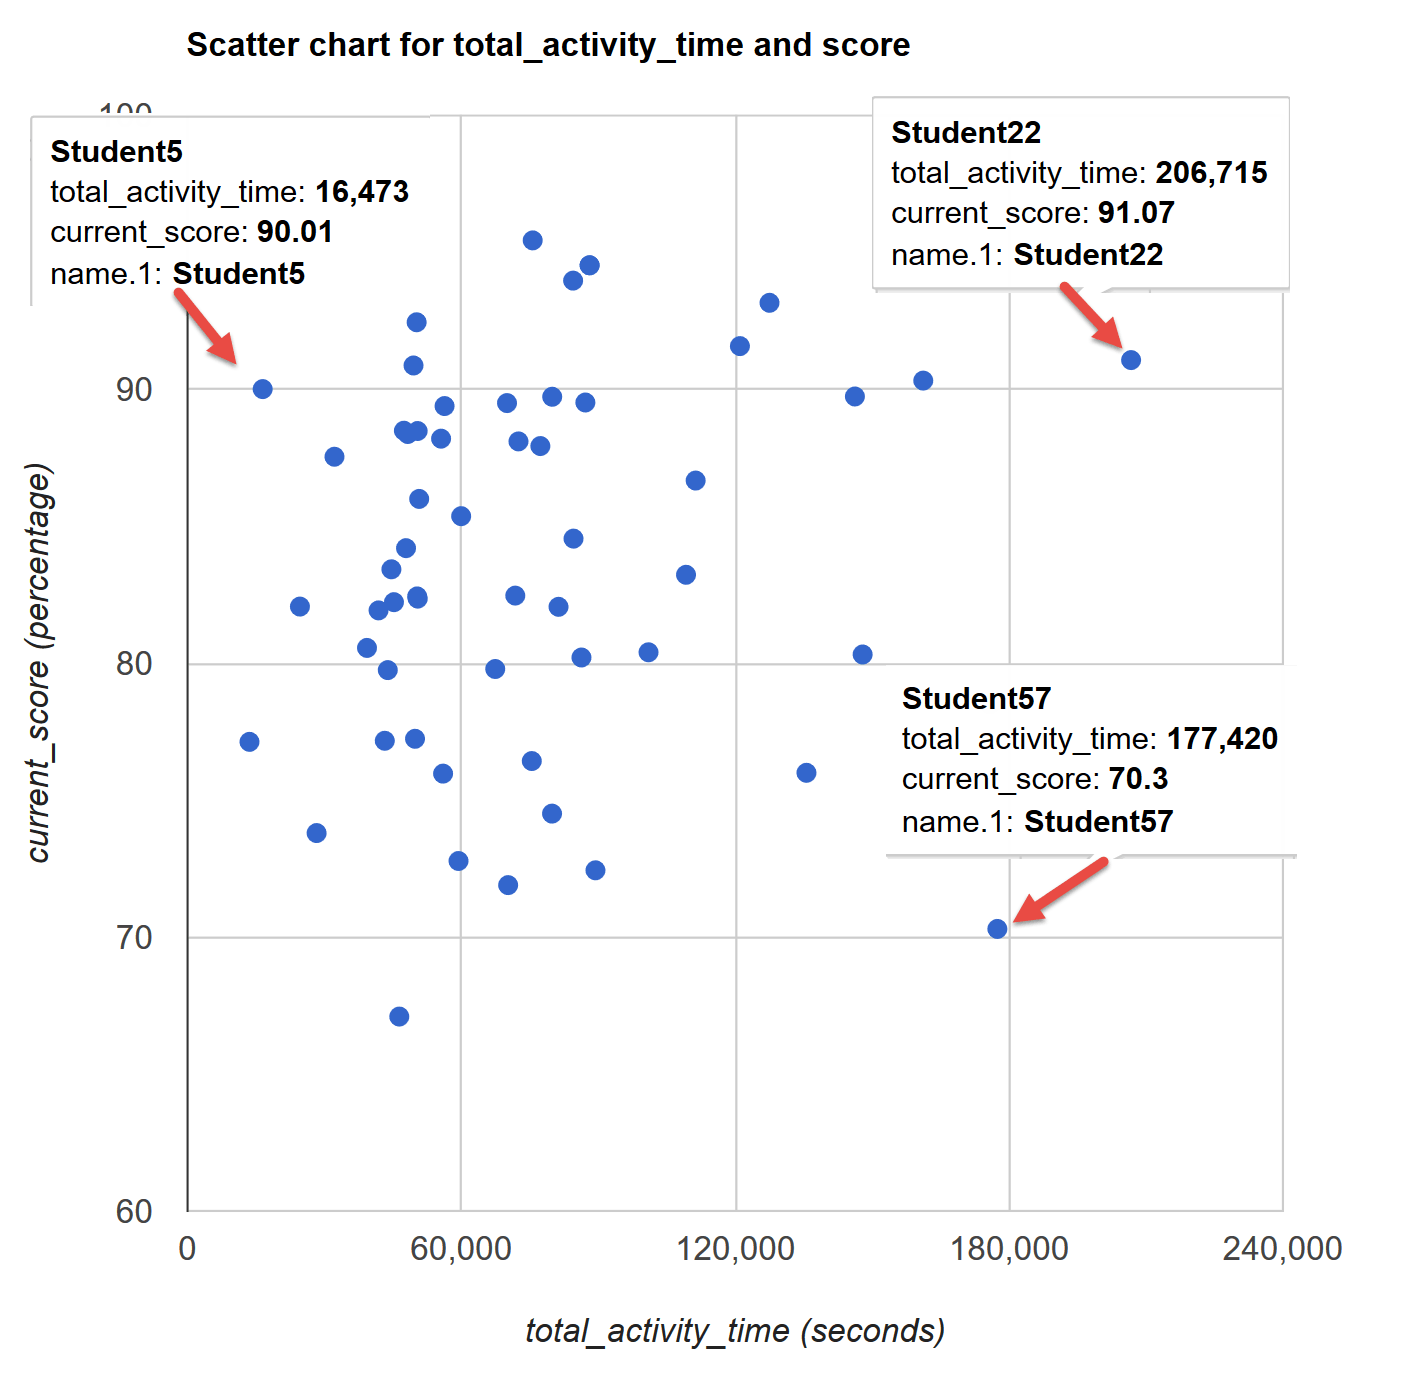
First, we are interested in learning whether there is a correlation between time spent in an LMS and performance. So we gathered LMS access data for a course and produced a scatter plot that shows the relationship between students activity time in a course and their performance on quiz. Although the scatter plot does not suggest strong relationship between course activity_time and quiz performance, it does reveal two ‘unique’ data points: One (marked as Student5) spent the least amount time (about 5 hours) in the course comparing to rest of the class, while did reasonably well on quizzes. The other one (marked as Student57) appeared to be quite active in the course (49 hours), but did not do as well as his/her peers did. Student22 seems to fit into the ‘ideal’ or ‘predictable’ model: If you spend time and study hard, you will perform well. For the sake of focus of this blog, we will only drill into file access activities for Student5 and Student57.
We know that there are many factors might have contributed to this scenario, but could comparing content access patterns between the two students shed some lights?
 This histogram shows the frequency of times all students viewed a given course content. The x-axis represents number of times a given content was clicked/viewed, and the y-axis corresponds to the frequency of individual times. The blue dot indicates the average times a given student accessed the content, and the black dot shows the mean of entire class.
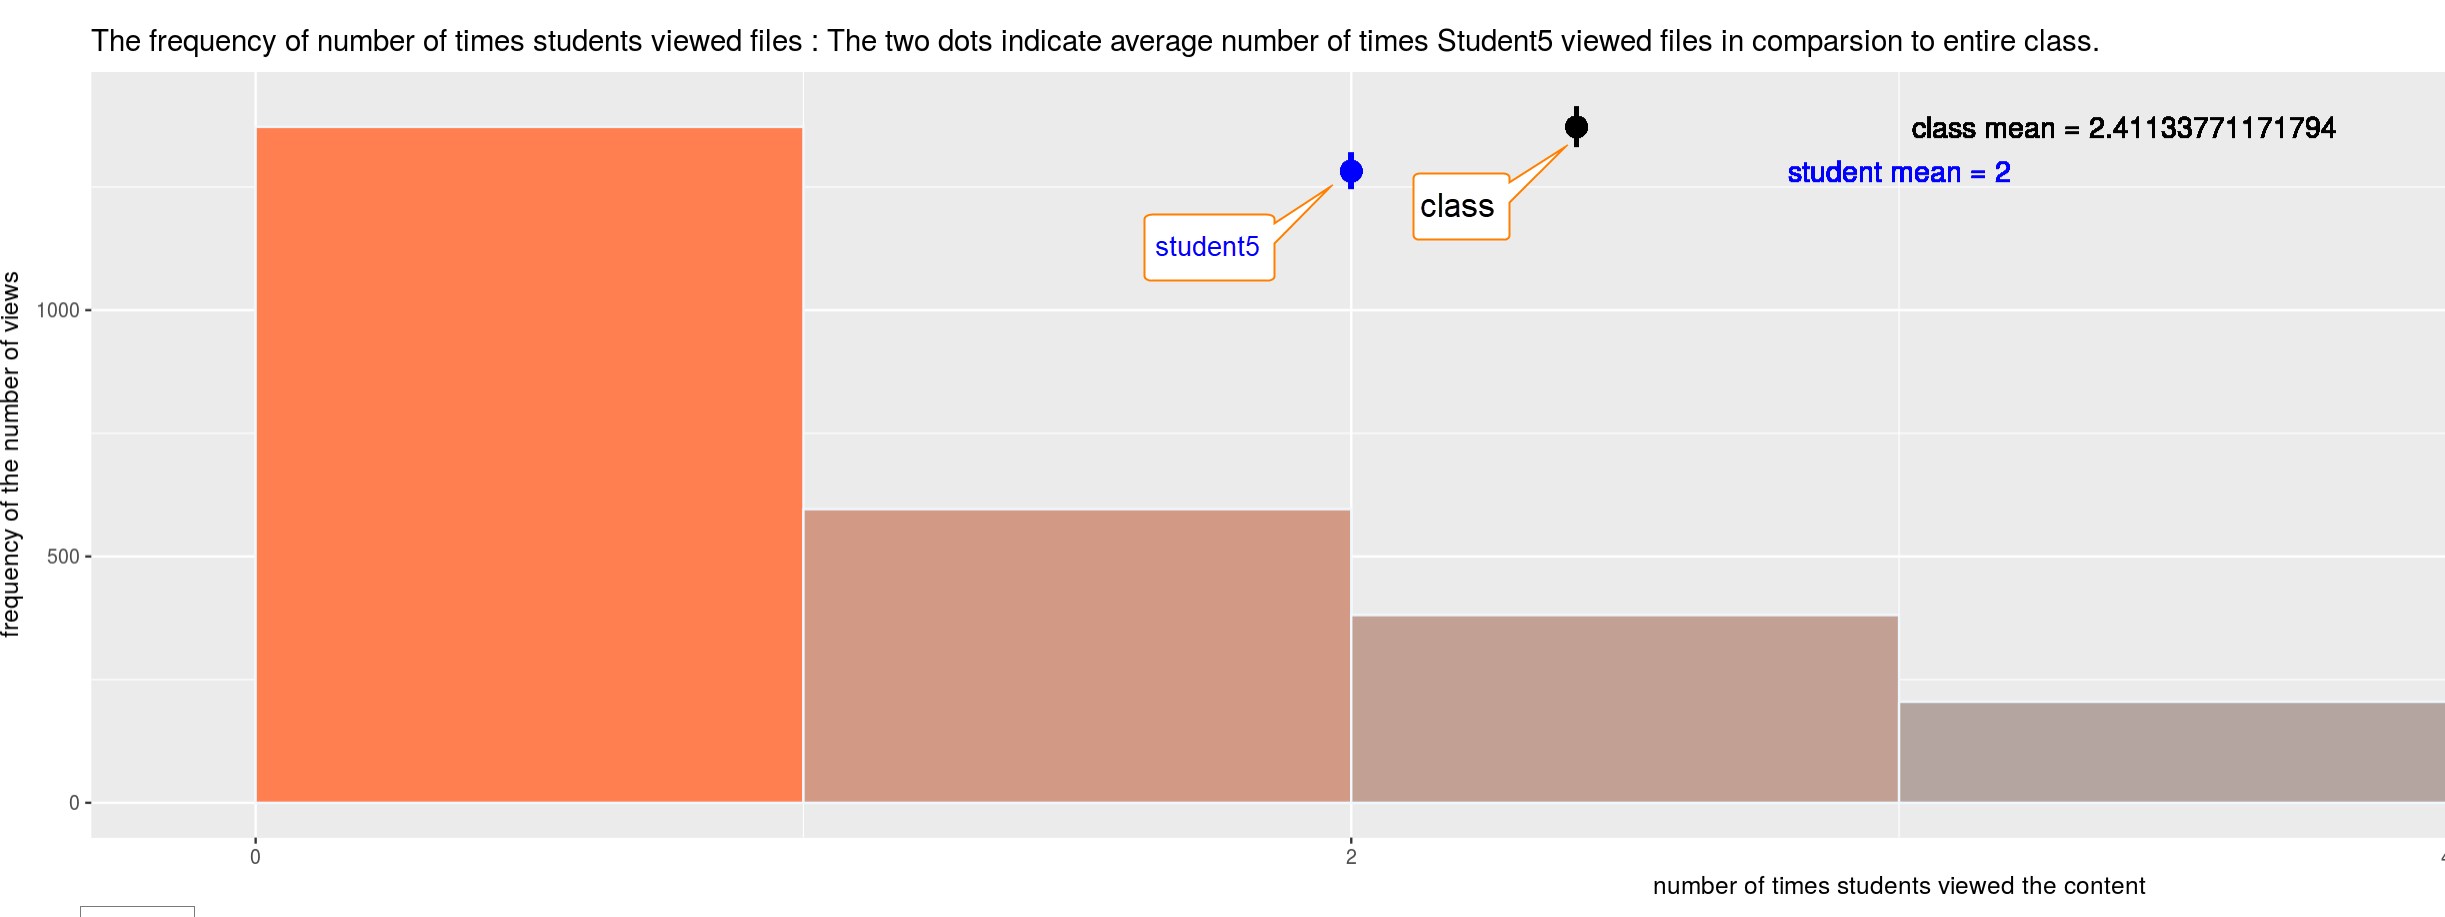 In this case, on average, the number of times that student5 accessed course files is less than the class mean.
We are interested in learning what files that Student5 and Student57 most reviewed/accessed. Were their top-accessed files also frequently viewed by the entire class? Did certain course material effectively prepare students for quizzes?
Let’s take a look of the list of files which Student5 and Student57 most frequently viewed. CourseMaterial206 and CourseMaterial108 show up as most-accessed-file for Student5 and Student57 respectively. In addition, in terms of file access, it does appear that Student5 and Student57 have different preference, because the lists of top reviewed files for the two students appear to be quite different.

 Now let’s take a look of the pattern of access to the two files by the entire class. We used Sankey diagram to visualize students’ access to a course material. Return_visit refers to re-visiting a course material after an initial access, or more specific, students accessed the same material again after the day for their initial visit. New_visit indicates that a student accessed a material, but has not returned to click on the same material beyond the day made initial access.
CourseMaterial206 show up as most-frequently-accessed-file for Student5. Interestingly, we notice that all CourseMaterial206 ‘visitors’ are return ‘visitors,’ which means that students who had accessed CourseMaterial206 all came back at various points and reviewed the material (CourseMaterial206) again. In comparison, CourseMaterial108, which Student57 most frequently accessed, is less ‘popular’ than CourseMaterial206. Majority students who had accessed CourseMaterial108 did not revisit the material after initial visit.
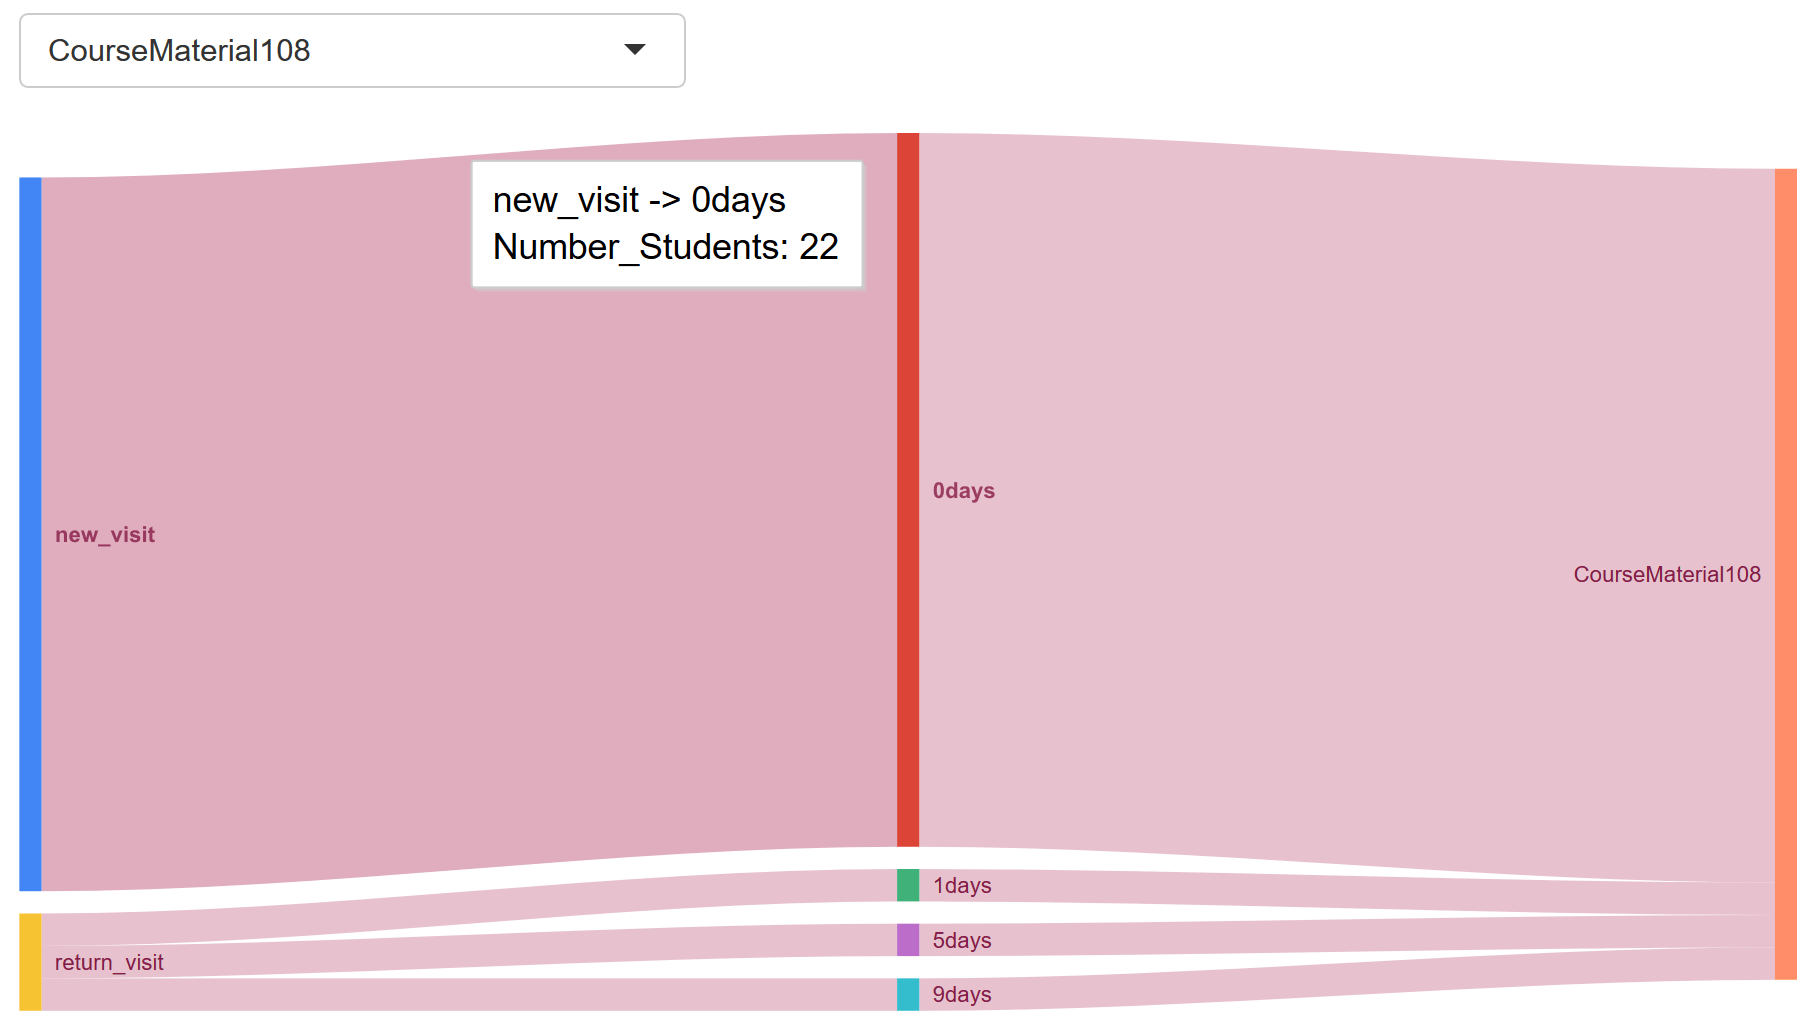 The data analysis and visualizations shed lights on good insights, but also lead to more questions: Why Student57 accessed CourseMaterial108 more times than rest of class? While didn’t Student57 review CourseMaterial206 like many of his peers did? Had Student57 been struggling with CourseMaterial108? Could additional help(intervention) or materials be provided to students like Student57?