

In previous blog, we talked about applying network visualization to course discussion interaction analysis. This blog demonstrates an example of using the visualization to analyze the impact of instructor involvement on student discussion interactions.
The following two graphs show student to student and instructor to student discussion interactions in two courses respectively. The two courses were offered in the same term under the same program and contain roughly the same number of enrollments. The discussion requirements specified in the two courses are identical. The results suggest that:
- Less instructor involvement coincides with more student-to-student interaction
- More instructor involvement coincides with longer student replies
- More instructor involvement coincides with greater student self-reflection
Graph 1: Each node represents a student who either received at least one feedback or provided at least one reply to another student. The size of each node suggests the quantity of interactions associated with the student. The thickness of each arrow line implies the length of a reply.
 Graph 1 is presented in ‘kamada.kawai’ layout:

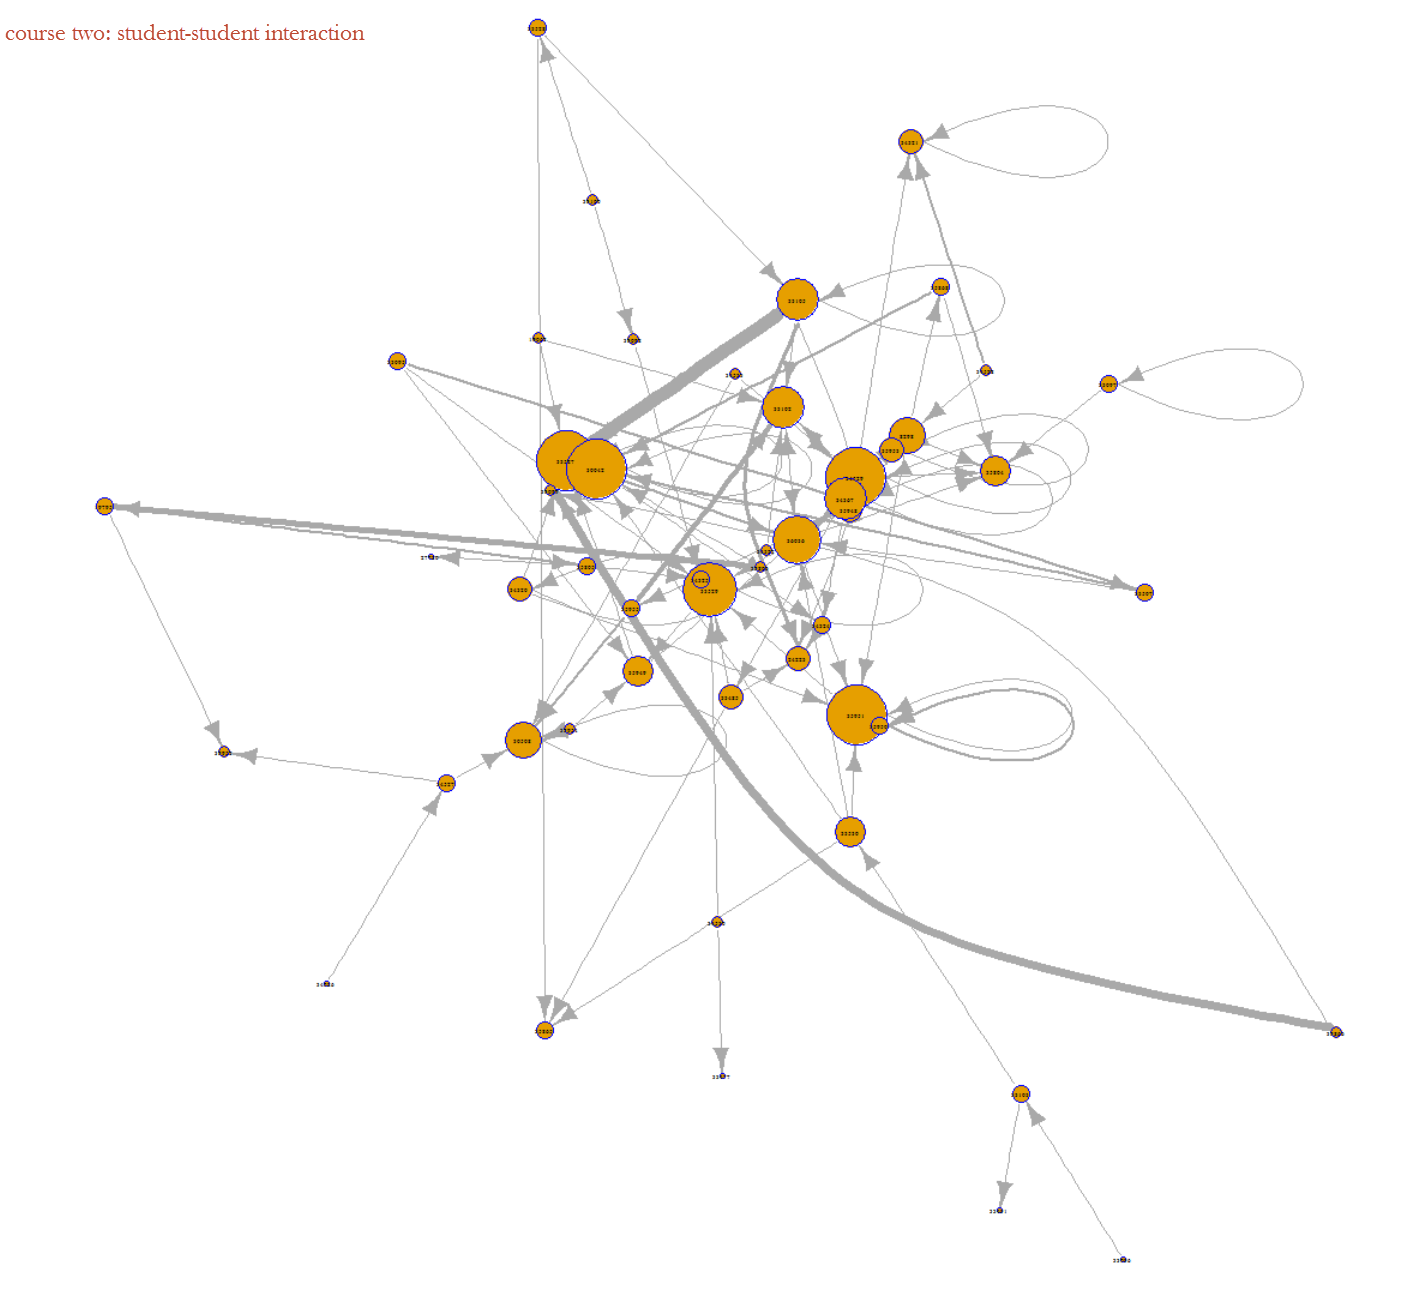
The two graphs above show that although course one students were fairly active in discussion activities, comparing to their counterparts in course two, course one students contributed more equally in terms of the length of replies (word counts of the threads) and the number of replies. In contrast, a few students in course two appear to have a greater quantity of the interaction, and yield a few longer replies.
Now, let’s take a look of instructor’s involvement in both courses. The course two instructors’ presence appear to be more evident than course one instructors, and instructors in course two provided more lengthy replies to their students than course one instructors.
Graph 2: the orange node in the middle represents the instructor who provided at least one reply to students. The size of each node suggests the number of replies made to students. The thickness of the arrow line implies the length of a reply.
