This is part 2 of a series I’m writing on how data can inform classroom and online discussions. If you’d like some background on this topic, check out part 1.
Jing Qi is one of my colleagues in Dartmouth’s Educational Technologies group. She’s our data master, and with her special skills we can navigate unseen worlds behind the Canvas Learning Management System. This is the system that many Dartmouth instructors use to host their courses and organize their course content. It is an awesome “one-stop-shop” for students to see their calendars, find their readings, submit their assignments, take comprehension quizzes, and contact their instructors. There is also another, sometimes underutilized, function in the Canvas system: discussion boards. These are places where instructors can post prompts and students can respond to one another. But often in online discussion boards, we see students make an initial post and then the conversations peter out.
Jing’s new shiny app helps us understand why certain conversations continue and certain conversations end. Using an easily installed script, we can help an instructor download discussion data directly from their Canvas course. The app makes data visualizations that can help an instructor understand what’s happening on the discussion boards and develop strategies for promoting deeper engagement among their students. Today, I’m writing about one suite of strategies, which I call the “node-based” approach. It’s heavily informed by the ideas of my colleague Scott Millspaugh, who recently presented this online at Canvas Live!
Scott is an instructional designer who works with faculty primarily in Arts & Humanities departments at Dartmouth (and co-facilitator of the Digital Humanities initiative to boot). Scott supports a course in which students are required to post comments on a weekly discussion board and reply to at least one other post. Some students get lots of responses. Some get none. Scott and the course instructor were curious about why.
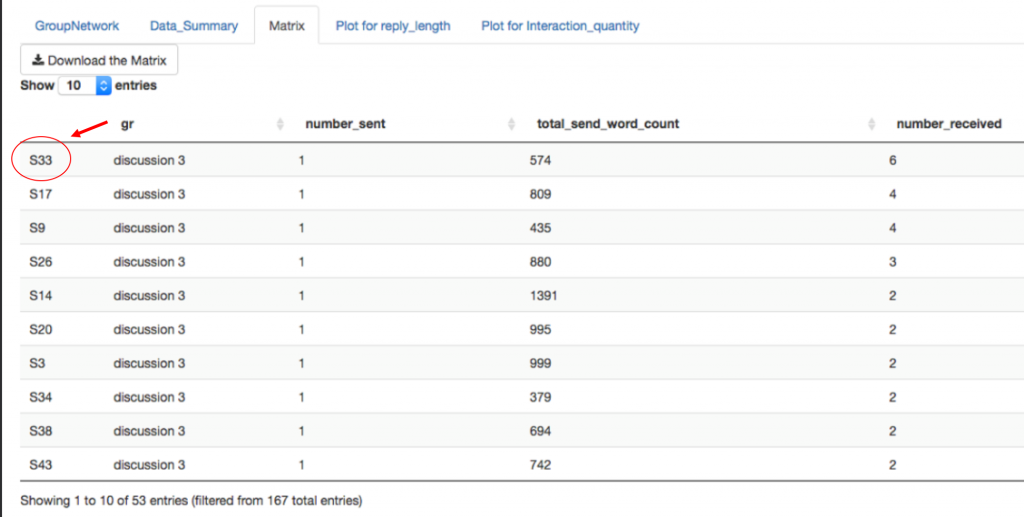
Using Jing’s app, Scott was able to construct a network of the students in the class and how they respond to one another. The network includes nodes, the places where the connections meet. Each of these nodes represents one student. Scott noticed that one student appeared to have more connections than other students. By checking the “matrix” tab in Jing’s app, Scott was able to confirm his hypothesis. The matrix tab showed each student and how many responses they had received to their posts [[photo 3]]. One student appeared at or near the top in all the discussions – a student we’ll call S33.

Jing Qi’s shiny app can help instructors see patterns in how students respond to online discussions. By clicking on the matrix tab, instructors can get a sense of which students have the most popular posts. We examined 3 discussions in this class, and student 33 (S33) received the most (or nearly the most) responses in every discussion.
In S33’s posts, we could detect certain patterns that weren’t present in other students’ posts. S33 wrote short responses, but they were inviting. The student often used subjective language like “I think,” “I feel,” or “I believe.” They asked other students directly what they might think or feel about the post. Conversely, the students in the class with the fewest responses often had the longest posts and tended to use the most academic, objective language. Now, big caveat: there might be other reasons that S33 has popular posts. Maybe the student is friends with many people in the class or seen as a person of influence on campus. But the patterns within the data are suggestive that S33 is doing something other students in the class are not.
The student often used subjective language like “I think,” “I feel,” or “I believe.”
The instructor can use this data to make a decision about using discussion boards. If the instructor wants students to converse with each other, the instructor can set a word limit and encourage students to share their personal thoughts. If the instructor is using the discussion boards to measure student comprehension of the reading material, the instructor might want to recommend a range for the word count and tell the students not to worry about responding to one another. Using data, the instructor can better articulate the goals of the assignments and how to best achieve those goals. In the process, we clear up expectations for the students.
So that’s one way that Jing’s app helps inform classroom and online discussions. In this approach, Scott saw a node in the network that was different than other nodes. He dug in deep to understand why the student at that point in the network was more successful (by one measure of success) than other students. Next week, I’ll talk about an alternative approach to dissecting data from discussion boards. I call it the “composition-based” approach, and it focuses on the students outside of the networks rather than those within it.
In the meantime, feel free to contact me with questions. You can comment here or email me at kes.schroer(at)dartmouth.edu.

