Quizzes are often used as an assessment tool to evaluate student understanding of course content. Practice quizzes, an informative self-assessment, have also been utilized to help students study for final exams. This self-assessment capability through the use of the practice tests enhances the usage level of course materials.
If course instructors used quizzing assessment strategy in Canvas, we can gather quiz submission data and use it to analyze the effectiveness of quiz questions. By analyzing the quiz submission data, course instructors are able to verify whether a quiz is effective in helping students grasp course content, and whether the quizzes produce meaningful data about students’ performance and understanding of course materials.
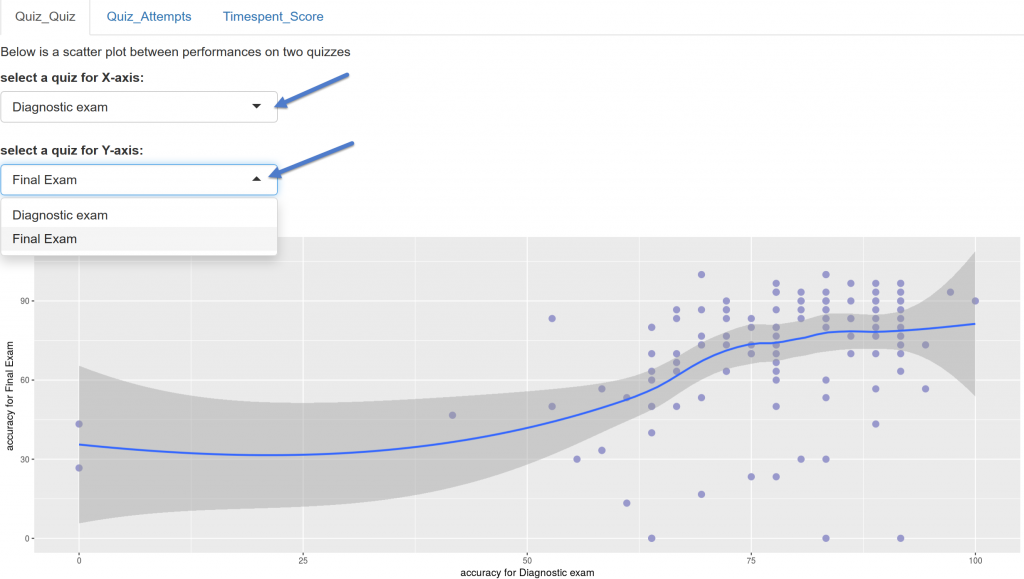
In this blog, we will introduce a self-service tool that leverages the quiz submission data to inform student learning and the efficacy of quiz designs in helping students master course materials. If a quiz is particularly designed for students to study for a high-stake exam or a formative assessment, we can use a scatter plot (with a smooth regression line) to see whether there is a correction between student performance on the practice test and on the final exam. If faculty implements a pre and post test to evaluate the efficacy of an instruction in helping student grasp course content, we can use a density plot to display the distribution of score percentage (kept_score/points_possible) for the pre and post quiz.
Canvas built-in Student Analysis tool allows course instructors to download quiz submissions data for one quiz at a time, and examine student performance. However, it is cumbersome if course instructors would like to to gather submission data for all quizzes in a course.
Course Instructors can install an userscript that gathers the submission data for all quizzes in a course:
- Install a browser add-on: Greasemonkey for Firefox or Tampermonkey for Chrome/Safari. Please skip this step if you have already installed the add-on previously.
- Install the Get Quiz Submission Data userscript.
- Login into Canvas, go to a course, navigate to the Quizzes page, scroll down to the bottom of the page and click on the “Get Quiz Submission Data” button.

- Save the data as ‘Comma Separated’ csv file format to your local computer, you may name it as ‘quiz.csv’
- Open Shiny app https://jing-zen-garden.shinyapps.io/quizzes/, load the quiz.csv file to the app, and a series of visualizations of the submission data will be created for you.
- The plot shows student score percentage in comparison to the mean and median score percentage for the class side by side, which allows course instructor to easily see where a student is at in relation to the entire class.

- If a quiz is particularly designed for student to practice for a high-stake exam, we can use a scatter plot (with a smooth regression line) to see whether there is a correction between student performance on the quiz and on the exam.

- If faculty would like to use a pre and post test to evaluate the effectiveness of an instructional strategy in helping student grasp course content, we can use a density plot to display the distribution of time_spent on the pre and post quiz and percentage (kept_score/points_possible) for the pre and post quiz.

- The plot shows student score percentage in comparison to the mean and median score percentage for the class side by side, which allows course instructor to easily see where a student is at in relation to the entire class.


Dear Jing Qi,
I love your blog and analyses. We recently migrated from Blackboard to Canvas, and for Blackboard we had similar analyses like yours. We did not get to reading in the Canvas data yet. Would you perhaps have R-code which allows for reading in the csv file produced by Canvas?
Yes, we built RStudio Shiny apps that pull Canvas data using APIs, save it in CSV file format, analyze, visualize the data and publish the visualization to Shiny server.