The types of educational activity data captured by a LMS that can be harnessed and translated to actionable knowledge:
- Click stream data
- Page views and content access
- Discussion participation
- Assignment and quiz submissions
Google Analytics for student’s click stream data:
Data solution 1: Nodes are points through which traffic flows. A connection represents the path from one node to another, and the volume of traffic along that path. An exit indicates where users left the flow. In Events view, exits don’t necessarily indicate exits from your site; exits only show that a traffic segment didn’t trigger another Event. Use the Behavior Flow report to investigate how engaged users are with your content and to identify potential content issues. The Behavior Flow can answer questions like:
- Did students go right from homepage to assignments/quizzes without additional navigation?
- Is there an event that is always triggered first? Does it lead students to more events or more pages?
- Are there paths through a course site that are more popular than others, and if so, are those the paths that you want students to follow?
Behavior Flow: Like all flow reports, the Behavior Flow report displays nodes, connections and exits, which represent the flow of traffic in a course site.
 Data solution 2: Funnel Visualization: how students funnel through to a destination page in your course site? https://support.google.com/analytics/answer/2976313 and https://support.google.com/analytics/answer/6180923
Funnel Visualization: The funnel visualization shows the stream of visitors who follow specific paths of a website and thus interact with it in order to reach a website goal. https://support.google.com/analytics/answer/2976313?hl=en
 The sample data for the example funnel visualization was gathered from a Canvas (LMS) course site, the goal was set to be the Modules navigation menu. 843 users accessed the course homepage during certain period of time. Of those 843 users. 31 percent of them went from the homepage directly to the course module page (destination). (581-177)/843=48% navigated to a different page of the course and 177(21%) exited the course.
The funnel conversion rate (59.20%) indicates the percentage of visits that included at least one page view for the first step before at least one page view of the goal page. Page views can occur non sequentially for a funnel match. We can look at each step of the funnel, analyze the number of users to the first step versus the number of users to the second step. Wherever we lost a drastic number of people, we can go back to that page and optimize it to increase that conversion rate percentage.
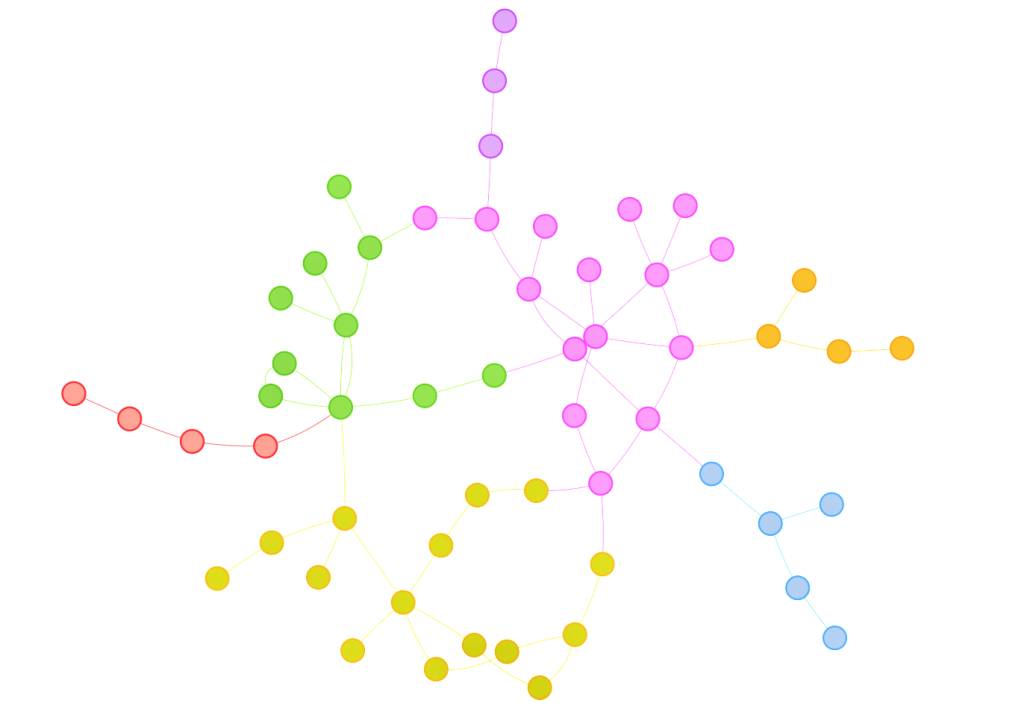
Social Network Analysis for discussion interaction data:
- How active do students interact with each other on online discussion forums?
- identify the students who are actively engaged in discussions by providing many comments to peers’ postings.
- identify the students whose initial discussion thread became so popular that received quite a number of replies.
- Does the quantity and/or richness of discussion posts vary across topics?
- Does the community structure of discussion interactions represent subgroups of students who have common interest in reality?
- Does discussion interaction patterns represent or reflect students’ participation in class activities?
- Does the role modeling using centrality metrics represents the level of influence of a student in reality?

Histogram and scatter plot for quiz submission data (quiz performance and correlation between quizzes):
- How well an individual student did in comparison to the entire class?
- What was the overall performance on a quiz?
- Is there a relationship between quiz performance and content access, or overall activities in a LMS?
References:
https://journal.r-project.org/archive/2016/RJ-2016-010/RJ-2016-010.pdf


