David Hererra '18 and Michael Smith '18
The UEFA Champions League (UCL) is a unique, dynamic, and exhilarating competition pitting champions from across Europe against one another. Soccer enthusiasts around the world regard the Champions League title as one of the most prestigious a club can win, given that teams often must defeat one or several champions or high finishers of other major domestic European leagues. The high profile, inter-league matchups deliver high level soccer that always pleases fans. Along with fostering matchups between marquee European clubs, the UCL provides a venue for champions from smaller domestic leagues to challenge the titans of Europe and to prove they belong on the European stage. The champions league is undoubtedly a grueling competition, requiring months of high-level play with little margin for error, and so we are asking a simple question: which road to victory has been the toughest?
Methodology
In order to evaluate how challenging the road to champions league victory really was, we needed to develop a common metric to weight teams from a diverse palette of European leagues. While a wide variety of methods were considered, we ultimately settled on a metric that combined a team’s domestic club performance at the end of the year and the domestic league coefficient, as given by UEFA, that applied to each club. Domestic performance was evaluated with a simple percentage calculation: number of points earned at the end of the domestic season divided by the total number of possible points a team could earn in that season. Given the benefit of hindsight, we believed that overall domestic league performance was the strongest indicator would had for the actual quality of the team in the year they participated in the UCL. After all, the domestic league is the primary competition for every European team and it provides the largest sample size of games. The UEFA domestic club coefficient was given by UEFA prior to the beginning of each competition.
The formula for each team weight is therefore given by:
(# points earned in domestic season)/(# possible domestic points)*UEFA league coefficient.
The UEFA league coefficient allowed us to normalize each team’s percent of possible points attained in their respective domestic league given the relative strength of their opposition. That is, teams in more difficult leagues are awarded a higher multiplier because the strength of their opponents was higher. It is clear that this metric has certain limitations. For example, by using the UEFA Coefficient, we recognize that some clubs are “double counted.” For example, Real Madrid adds to Spain’s domestic league coefficient, which in turn adds to the weight of Real Madrid as the quality of an opponent in this study. Furthermore, we recognize that club performance throughout a season ebbs and flows; injuries, transfers, momentum, and other factors can all influence a team’s quality of play at a given point in the season. Depending on when two clubs faced off and those clubs’ form at that point in time, a match could have been slightly tougher or easier. However, we believed that the variance introduced by these small changes in form would not be very large. Furthermore, in analyzing the retrospective performance of the team, we believe we generate a form of “quality smoothing” in which periods of weak play are offset by periods of strong play, more or less driving a reversion toward the mean.
Findings
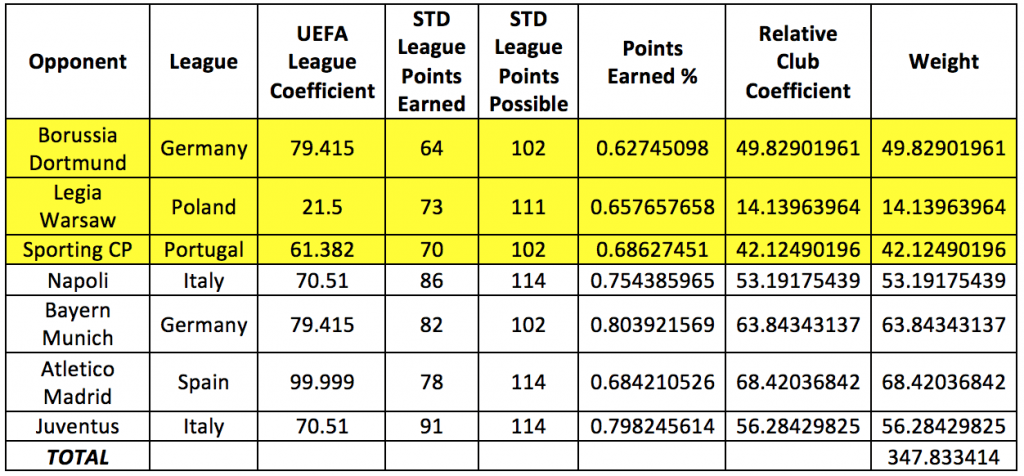
Using these metrics, we found the “difficulty” measure for the past 10 years of UCL tournament play:

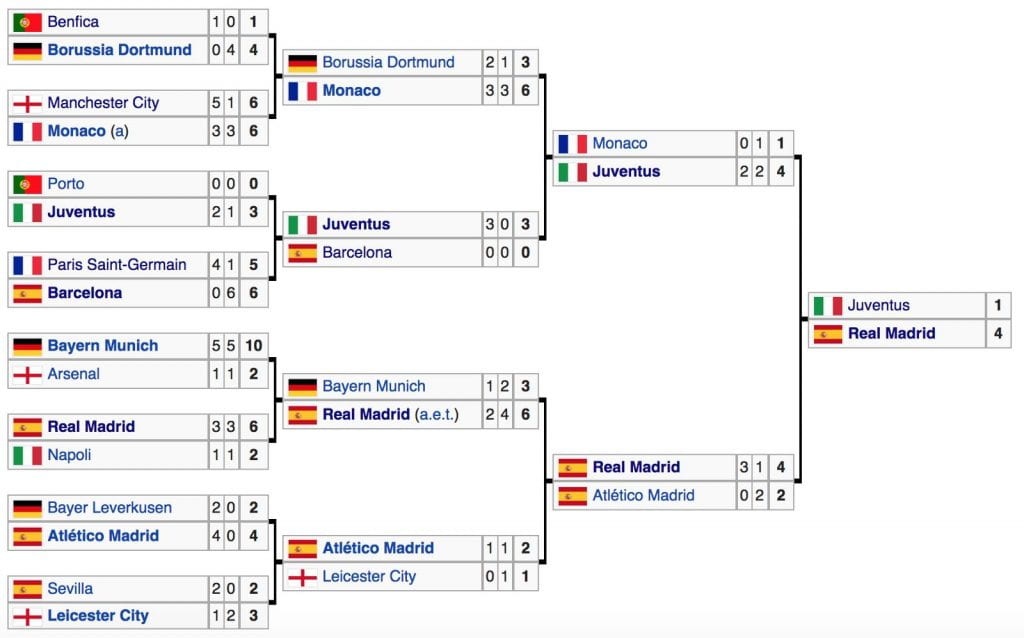
We can see that in the past decade, Real Madrid’s 2016–2017 title is, by our metric, the most difficult Champions League victory. Real Madrid also had the second toughest road to victory in 2013–2014. Conversely, Milan’s title in 2006–2007 was the easiest title by our metric — over 40% easier than Real Madrid’s most recent title! Shown in Table 1 is a sample calculation for opponent weightings for Real Madrid in their 2016–2017 UCL Champions league run. Group stage opponents are highlighted in yellow. Aside from the final match, each team was played twice, once home and once away. If teams happened to play one another in the group stage and in the knockout stage, we added the weight of that team twice.
Additional Insights
Interestingly, we found a general upward trend in the weightings of clubs that made appearances in all UCL competitions since 2006–2007. Like in the NBA, there has been a growing trend of consolidation of quality players into a select few teams in the European football leagues. While numerous explanations for this trend are possible, our best guess is that increased TV contracts and club revenues have liberated clubs to pay their players larger contracts than smaller clubs can afford. Better results breeds more revenues, and even greater latitude to pay players well.
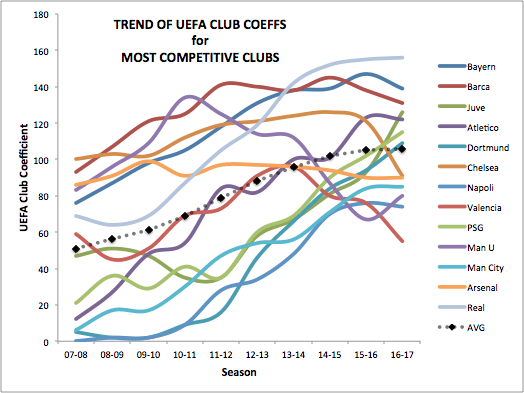

The graph above compares teams that are frequent competitors in the UCL. The dark, dotted trend shows the average of all squads. The average begins with at a UEFA score of 51 and ends at 106, more than doubling over the past 10 years. However, this could just be an effect of overall improved play in international soccer.
To see if there is a more widespread trend of improved play in soccer, we consider the main European leagues in Graph 3 above. Again, the average of the league improves over the 10 seasons (from 60 to 76). However, this could be explained by the improvements in individual squads, as we saw in Graph 2. This does not explain the stagnancy of Ligue 1 in France, though, while Graph 2 shows aggressive improvement for Paris Saint-Germain F.C. (PSG).
For the 2009–2010 season, UEFA altered the format of their European competitions, most notably the UEFA Cup, which was renamed to the UEFA Europa League. The major changes to the format included the expansion of the Europa League to 48 teams from 32, along with a wrinkle in which teams that finished third in their respective Champions League groups were shifted to the Europa League. This reformatting expanded the number of European games a team could play, which created more potential opportunities for a team to add to its individual club coefficient and its respective country coefficient sum.
We see two major effects of this reformatting. The first effect is that teams overall have more games in European competition, and thus a greater chance to run up coefficients. The greater pool of games could explain the overall positive trend we see in country coefficients across Europe.
A second, and perhaps less obvious, effect of the expanded format is that it gives individual teams, especially those that were knocked out of the Champions League, a chance to add to their individual scores. In other words, this effect could amplify the consolidation of the coefficients at the top, since teams that are bounced from the UCL can still recover coefficient points by marching through the Europa League.
In the end, we can view the expanded format as having opened up more opportunities for teams to win European games and boost the coefficients of their domestic leagues.
Next Steps
One of the most interesting observations from this study is the stark upward trend of the top clubs in Europe. We believe delving deeper into the causative elements of this trend would be a worthwhile study. We also believe that the methods applied in this study can be used to study the “toughest” road for other sports that involve a season that is drawn out over a long period of time; the NFL, college football, or even college basketball could be good candidate sports for such an investigation.