Data and Updates
1/5/2011
Recent efforts using the Elephant facility have included further characterizing its parameter space and how the plasma evolves during its two-stage generation process. The two-stages correspond to separate regions which have very different plasma parameters. The first, the resonance cavity is where the plasma is generated. The second is the large, main experimental chamber where experiments are preformed. These regions are separated by a “backplate” which is an electrically floating plane with small holes the plasma can diffuse through.
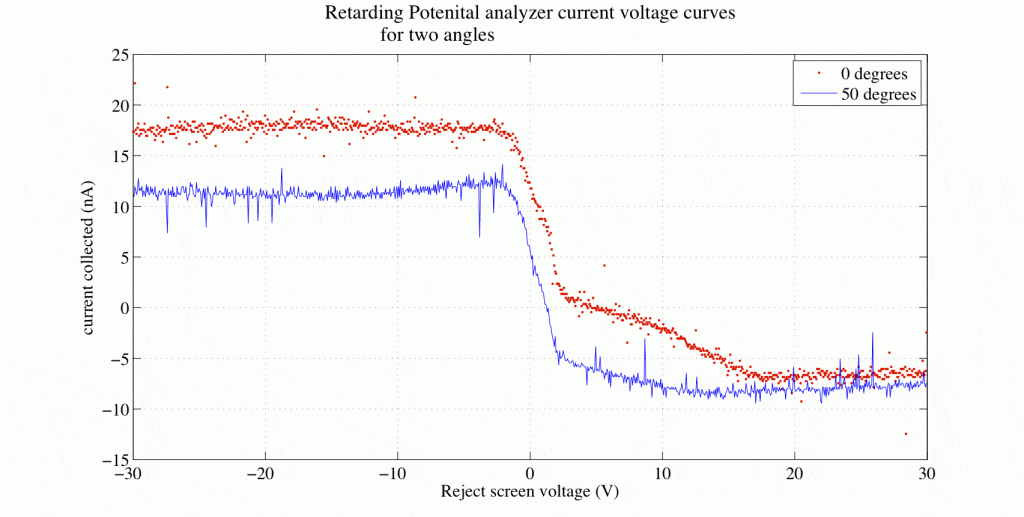
In brief, the neutral argon gas is ionized in a resonance cavity by microwave frequency electromagnetic waves. This breakdown of the gas results in an electron temperature of approximately 3eV and a plasma density on the order of 1E11/cc. A small fraction of this plasma is processed through the plasma sheath of the backplate and enters the main experimental chamber. This creates a flowing ion population, where this kinetic flow energy can be observed on a retarding potential analyzer’s current-voltage (IV) trace (click for larger image).
We can also use our theoretical prediction for density and temperature in the resonance cavity, along with the geometrical factors, to predict the resulting density in the chamber. These predictions are not perfect due to power being absorbed by elements other than the plasma which heat over the course of the experiments. These complications remain to be fully parameterized, but the theory gives us an upper bound.
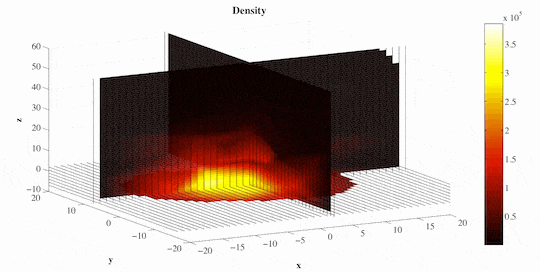
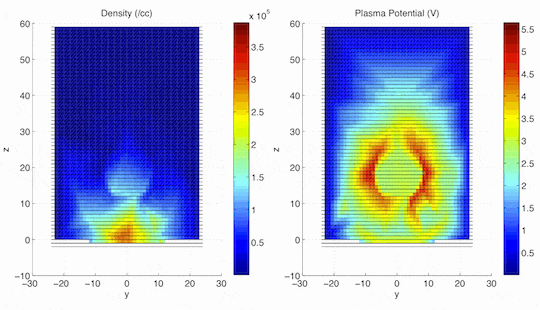
More extensive “mapping” efforts have also been underway to explore the homogeneity of the plasma. The following figure is a density map of the plasma in the chamber interpolated from approximately 100 point measurements with a boundary condition that the density goes to zero at the walls (click for larger image).
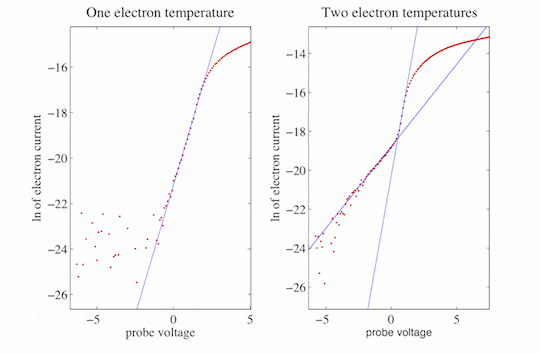
During this mapping, we have observed that our Langmuir probe IV curves possibly exhibit the presence of a second electron population, hotter than the dominant population
However, we cannot assert with absolute confidence that this is an electron signature since it depends on a carefully subtraction of the ion current, and thus could be an artifact of this subtraction. However, the appearance of either this second population or an oddity in the ion collection occurs near the resonance cavity. Only a single hotter population (with temperature similar to the “second population” temperature observed near the resonance cavity) occurs in the rear of the chamber far from the source.
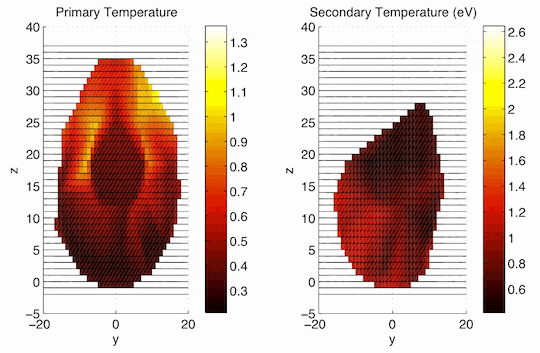
In the following plot, a 2D slice of the chamber is shown, the z=-2 inches is the backplate, z=40 is the rear of the chamber. If there is only one temperature, it is shown as the ÒprimaryÓ temperature. If a certain location has two temperatures, the less more energetic, less dense population is plotted as a “secondary” temperature. Note that these plots have different color bars.
A few possibilities exist to explain these temperature features.
First, there are truly two electron populations, and the colder, lower energy population cannot reach the rear of the chamber leaving only the hotter more energetic population entering that region. However, this begs the question of where are the cold particles being lost, or what are they being heated by?
Second, only the one cold population exists. Near the resonance cavity we see an artifact of an inaccurate ion subtraction and near the rear of the cavity there are lower densities and thus less accurate IV curves which could artificially inflate the temperature. The fact that both these errors appear as an approximately 1eV electron population in the IV curve is a coincidence.
You can also see in this figure the large effect of the translational arm (a long stainless steel cylinder which can be manually adjusted to move probes inside the chamber) on plasma features. The plasma appears colder near the arm, it also appears more dense and lowers the potential (since grounded).
The large effect of the translational arm was unexpected since the plasma feels the effect of the arm more than “a few” debye lengths away.
9/9/2005
After being installed in Wilder Lab, installation of flanges, pumps, and related hardware went quickly. Dartmouth Facilities and Operations crew set up power, pressurized air, and cooling water for the room. We now have the capability to pump down to 5.7E-8 Torr, which is quite good considering just how much volume is evacuated. Fabrication of the microwave plasma source is well underway, as all parts are out of the machine shop and are ready for vacuum welding. It is a busy and exciting time in the laboratory.
