Keograms from Don Hampton
Kaktovik red line(0900UT-1300UT)

Kaktovik red line(1000UT-1200UT)

Kaktovik green line(1000UT-1200UT)

Kaktovik green line(0900UT-1300UT)

Toolik green line (0900UT-1100UT)

Toolik green line (1000UT-1200UT)

Toolik green line with Intensities(1000UT-1200UT) higher resolution with trajectory

Toolik green line(1000UT-1200UT) higher resolution

Keograms from Hanna Dahlgren
Alaskan Magnetometer Chain

Particle Data from Meghan
Updated plots, 29 May 2009
For interesting times (Ions, Main, HM ): c2hm27
Full flight and 100s increments (Ions, Main, HM): c2hm28
For interesting times (Electrons, Main, HEDF): c2he17
Full flight and 100s increments (Electrons, Main, HEDF): c2he19
Koala:

For interesting times (Electrons, PFF1, HEDF)
Full flight and 100s increments (Electrons, PFF1, HEDF)
For interesting early times (Electrons, Main, BAGEL)\
Full flight and 100s increments up to 500s (Electrons, Main, BAGEL)
For interesting late times (Electrons, Main, BAGEL)
100s increments for after 500s (Electrons, Main, BAGEL)
Main Electron Energy Flux (arbitrary units) from 560 to 660s
Main Electron Energy Flux (arbitrary units) full flight
Electric Field Data from Erik Lundberg
E field Survey for AFT payload
AFT HF12 Snapshots:

Added 17 April 2009:
BBELF:

Comparison Plots Added 24 April 2009.
Comparison plots (with ions)
MainAftVLF,BBELF,Ions,Electrons,DC,200_700
MainAftVLF,BBELF,Ions,Electrons,DC,210_250
MainAftVLF,BBELF,Ions,Electrons,DC,260_380
MainAftVLF,BBELF,Ions,Electrons,DC,400_450
MainAftVLF,BBELF,Ions,Electrons,DC,460_520
MainAftVLF,BBELF,Ions,Electrons,DC,530_580
MainAftVLF,BBELF,Ions,Electrons,DC,550_560
MainAftVLF,BBELF,Ions,Electrons,DC,550_650
MainAftVLF,BBELF,Ions,Electrons,DC,575_630
MainAftVLF,BBELF,Ions,Electrons,DC,585_593
MainAftVLF,BBELF,Ions,Electrons,DC,586_591
MainAftVLF,BBELF,Ions,Electrons,DC,620_630
AFT Despun 200-250

AFT Despun 250-300

AFT Despun 300-350

AFT Despun 350-400

AFT Despun 400-450

AFT Despun 450-500

AFT Despun 500-510

AFT Despun 550-600

AFT Despun 585-593

AFT Despun 595-620

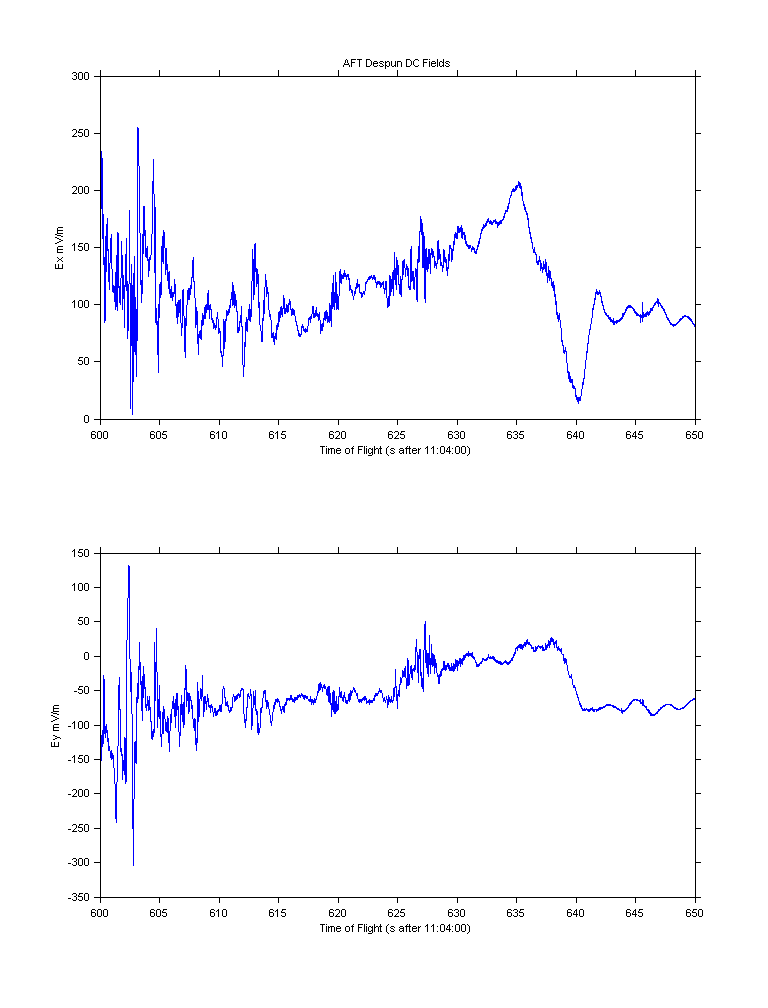
AFT Despun 600-650
AFT Despun 620-700

AFT Despun 650-700

AFT Despun 700-750

*a new .zip file from Erik, 18 September 2009–C2fields
Here is an explanation of the above files:
There are about 15 plots attached (if they fit), which are different visualizations of the CASCADES-2 DC E-field data over 3 different time periods of the flight. One of these is 300-310s, which I included to show the “noise level” in electric field data despun by a preliminary attitude solution (I think I can still reduce this noise), note that this is the region where the attitude solution does the worst. Most of this is due to error in the attitude solution and error in applying the attitude solution to despin the data.
The second is 586-590s which is a short period of really intense DC fields, but is short enough to fit lots of information on few plots. Looking at just the FWD and AFT data I think we observe vortices like what have been presented for the magnetosphere here (http://www.nature.com/nature/journal/v436/n7052/full/nature03931.html). But then when we difference the payloads we see even more structure, although the amplitude is smaller they are more frequent. I am going to bring this to Professor Seyler today to see what he thinks. It’ll be interesting to see magnetic fields here.
The third is the big field reversal at around 640s which Kristina seems really interested in. Here the 2d plots might be most illuminating. The noisy bubble in the 2-d hodogram of the differences is shifted ~20-30 mV/m north, ie if the field is 20mV/m stronger in the northern direction at the FWD payload and there is very little difference in the East direction. How far along is the camera data here? I think this data will be best interpreted at a velocity (V = EcrossB/B^2), which is something I am working on.
* a new .zip file from Erik, 22 September 2009
Magnetometer Data from Ben Feintzeig
B mag minus B igrf

B mag minus B igrf smoothed

BZ offset

Detrended Difference in Cos Theta 250 to 750 Smoothed

Detrended Difference in Cos Theta 585 to 593

Detrended Difference in Cos Theta 595 to 620

Difference in Cos Theta 200 to 800

Difference in Cos Theta 250 to 750 Smoothed

Difference in Cos Theta 575 to 650

Difference in Cos Theta 575 to 650 Smoothed

GPS Data from Steve Powell
GPS Data from Mike Disbrow
Main to PFF1 conjugacy text file
Radar Data from Jim Diehl
Interpayload TM timing from Jim Diehl
PFISR Data from Mike Nicolls
Electron Temperature, before and after launch:

Ion Temperature, before and after launch:

Temperature ratio, before an after launch:

Line of Sight Velocities, before and after launch:

Vector Velocities, before and after launch:

Electron Density before and after launch, Long Pulse:

Electron Density; before, after, and during launch, Barker Code:

Electron Density; before and after launch, Barker Code:

Electron Density during flight, Barker Code, 20s integration period:

Electron Density before and after flight, Long Pulse, higher resolution:

Map of Beams:

THEMIS Data
These files are copied from the THEMIS data page.
THEMIS-E:

THEMIS-D:

THEMIS-A:

THEMIS key:

THEMIS Data from Sason
THEMIS-A 1:

THEMIS-A 2:

THEMIS-D 1:

THEMIS-D 2:

THEMIS-E 1:

THEMIS-E 2:

THEMIS Data
Added 17 April 2009.
THEMIS Allsky image:

THEMIS Footpoint Map from John Bonnell (UC Berkeley):

THEMIS Allsky movie from Jiang Liu:
Summary Data from Mark Widholm
ERPA data:

Main HET (electrons) extracted using DotsPad:

ERPA data from Kristina
Payload Charging:

Payload Charging 2:

Narrow Field Camera from Kaktovic
Toolik Lake Allsky with Cascades2 Trajectory
Poker Flat Allsky
Additional Movies
Kaktovic Allsky movie from 480s-510s flight time, with footpoint from Robert Michell:
Toolik NFC Movie with footpoint from Hanna Dahlgren
Kaktovik NFC movie 575-650s flight time from Jim:
Poker Flat NFC movie from Robert Michell:
Kaktovik allsky with 110km footpoint from Robert Michell:
Kaktovik allsky with 110km footpoint from Don Hampton:
Kaktovik allsky with 150km footpoint from Don Hampton:
Toolik allsky with 110km footpoint from Don Hampton:
Toolik allsky with 150km footpoint from Don Hampton:
Kaktovik allsky with many footpoints from Don Hampton:
Main electron images with energy on the y axis and pitch angle on the x:
Main ion images with energy on the y axis and pitch angle on the x:
PFF1 electron images with energy on the y axis and pitch on the x:***
Presentations
Kristina’s Plasma Seminar Talk, 19 May 2009
Meghan’s Thesis Proposal, 15 May 2009
Hanna’s IPELS Poster, June 2009
Meghan’s GEM Poster, 25 June 2009
Kristina’s CEDAR Presentation, 29 June 2009
Kristina’s Fall 2009 AGU abstract
Erik’s Fall 2009 AGU abstracts
Meghan’s Fall 2009 AGU abstract
CASCADES-2 Science Meeting, Oct. 29-30 2009
K: Overview of mission and event
Meghan: overview of particle data
Erik: overview of CASCADES2 Field Data
Jim: overview of HF data
Hanna: overview of camera data (see below for presentation)
JohnB: view of event from Themis point of view
Presentations of analysis details
Presentations of analysis details
Hanna: camera data analysis: keograms, stereo view, energy fluxes with movies side by side and tall rays (shown below)
Side by Side
Tall rays
K: PFISR, ERPAs, HT: densities and spacecraft potential
Meghan: details of PBI classifications of different portions of the event
Erik, Meghan, K: details of vortex structures (see below for region of interest) and particle Motion; mag analysis
Josh: PBI topics and camera observations
Marc: PI1b and M/I coupling
Erik/Meghan: 580 event 602 event and 640 event
Intro/overview of scifer2 and ropa studies
Sarah on Ropa: low-energy signatures of pulsating aurora
Allison on Scifer2: UV PMT and neutral oxygen above 1000 km with allsky movie:
Erik on Scifer2&Ropa: wave activity and ion precipitation ROPA Status and SCIFER2 Status