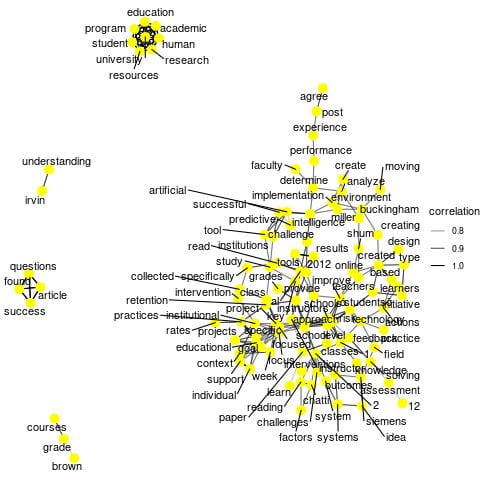
The promise of Learning Analytics is a broad concept, I would like to use network and word correlation analysis to demonstrate micro-level analytics involves the finer-grained process data for individual learners, and answer a simple question, “what kinds of learning are we really able to track with LA?” In this context, Micro-level analytics is used as a technology of epistemology, and entails collaborative efforts among educators and learners.
Generally speaking, a well-designed course encourages both individual accomplishment and group knowledge construction. The core element of rich learning data, which we can harness, is around conversations and interactions. In the following, we will demonstrate an example of micro-level learning analytics. We employed community detection method to identify the nodes which were more closely connected within than to outside, and used natural language processing approach to examine the quality of learning conversations.
Networks often have different clusters or communities of nodes that are more densely connected to each other than to the rest of the network. The algorithm for detecting community is to identify subsets of network that are more connected within than to the rest of the network. Let’s harness the learner interaction data in a course to identify peripheral community if there is any. Each node represents a student of the class, and the edges indicate interactions, the quantity of each students responding to one another.
For the sake of this demonstration, we applied two different methods for community detection. Despite the fact that a few nodes were grouped to different clusters by comparing the two results, the peripheral subset (S1 and S11) pops out consistently in both diagrams. The diagram evolves as the dynamic of learner interaction shifts. With this information, faculty can easily tell whether there are ‘isolated’ groups or peripheral nodes. If there is any, they can further explore the possible factors contribute to such pattern, and make data-informed intervention if needed.
An even better way to understand the content of each cluster is to combine text analysis. To get a better understanding of the numerous relationships exist, we can use a network graph to depict words correlations. Let’s take a look of networks of words where the correlation is fairly high (> .70). The first graph was derived from the entire class, shows a few clusters with words appearing together more frequently than others. For instance, one cluster shows that education, human, resources, and a few other terms are more likely to appear together than not. This type of graph provides a great starting point to find content relationships within text. The second and third network graphs represent word relationships derived from the conversations contributed by S1 and S11 respectively.
Now back to the topic, the Promise of Learning Analytics, we must not ignore the human factor in algorithms. In order for educators to provide proper interventions, and for the learners to follow guidance and achieve desirable actions/behaviors, both educators and learners must be part of the process. They need to be trained and equipped with keen information as to what types of learning data was harnessed, and how the results were derived.
References:
Text Mining: Word Relationships. https://uc-r.github.io/word_relationships
The Promise of Learning Analytics. (2014, June 13). http://elearninginfographics.com/the-promise-of-learning-analytics-infographic
Buckingham Shum, S. (2012). Learning analytics: Policy Brief. Moscow: UNESCO Institute for Information Technologies in Education. http://iite.unesco.org/files/policy_briefs/pdf/en/learning_analytics.pdf


