Changes in Canvas course content over time

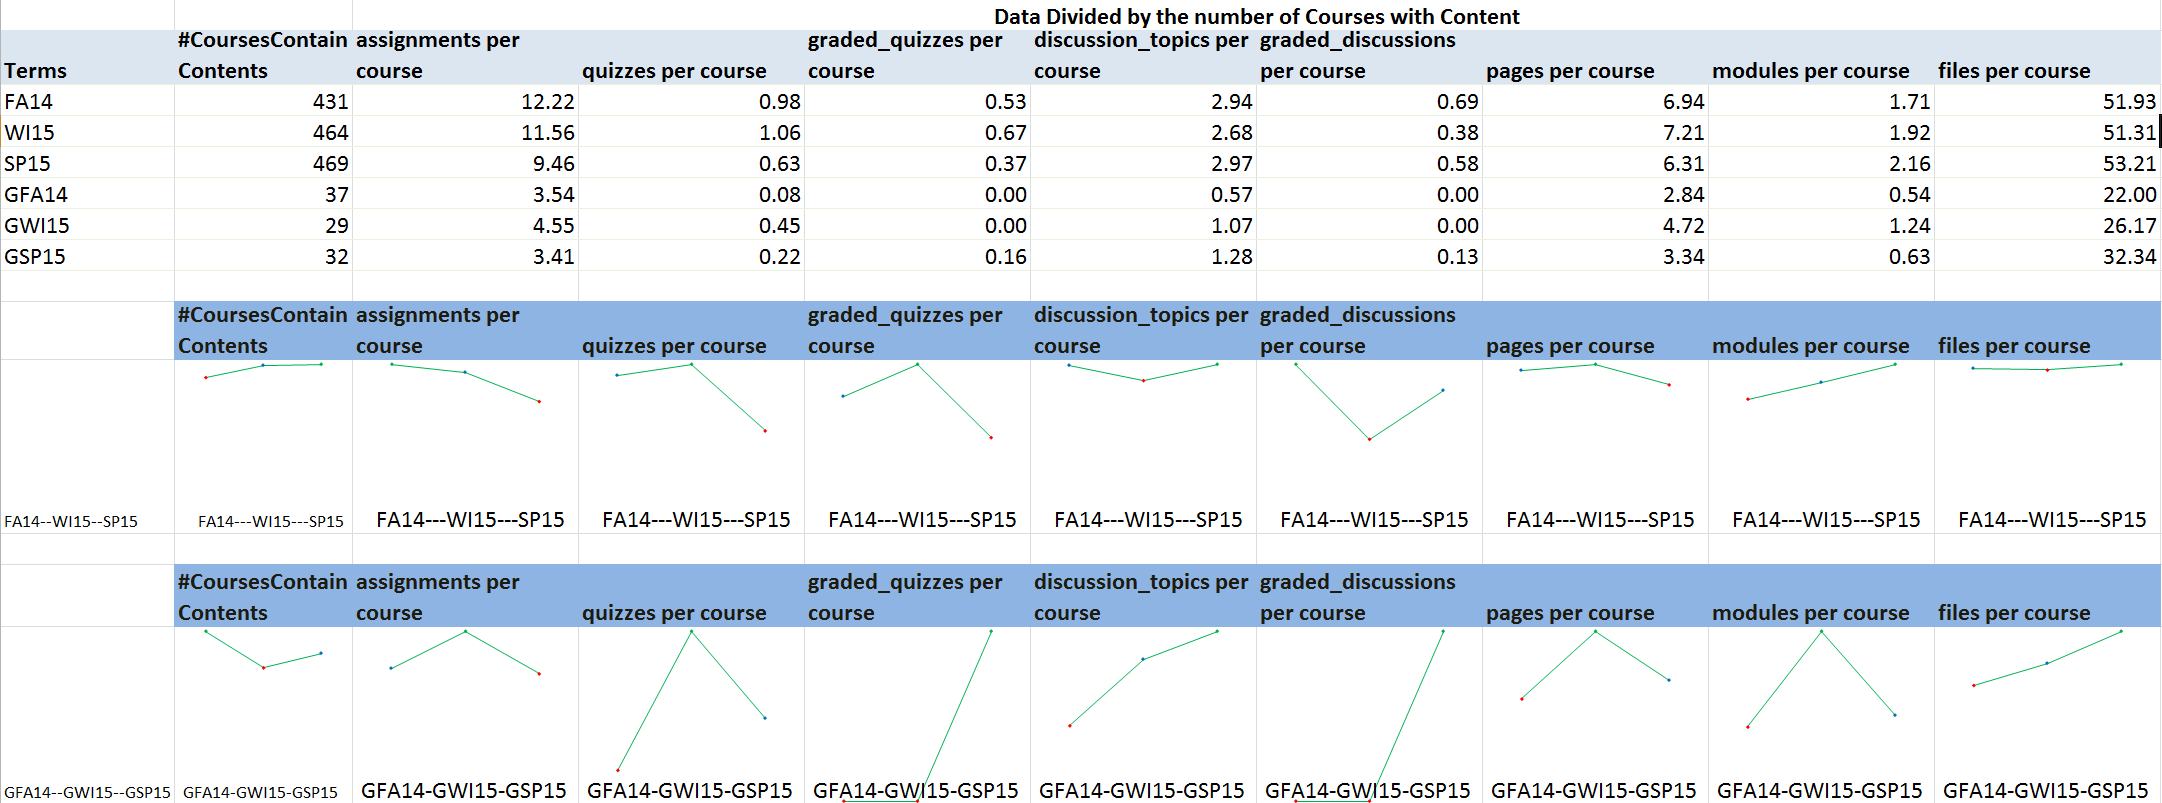
By Winter 2015, Dartmouth completely transitioned out of Blackboard, and began using Canvas as its primary LMS. We are interested in learning how Canvas has been utilized as an extension to face-to-face learning experience. The following chart suggests:

  • A&S undergraduate and graduate level courses show different changes over the three terms,
  • more SP15 undergraduate level courses adopted module-based design compared to WI15 term,
  • compare to WI15, fewer SP15 graduate level courses used either page or module to deliver content, in contrast, graduate level courses tend to use Canvas to administer more quizzes and facilitate more discussions,
  • among A&S undergraduate level courses, the chart reveals that as the number of published Canvas courses grows, the average number of assignments per course goes down.

We plan on consistently collecting similar set of descriptive data, and comparing the results to examine whether and how the pattern evolves over time. We are also in the process of gathering more data for diagnostic analysis in an attempt to identify elements that contributed to the changes.

CanvasCourses

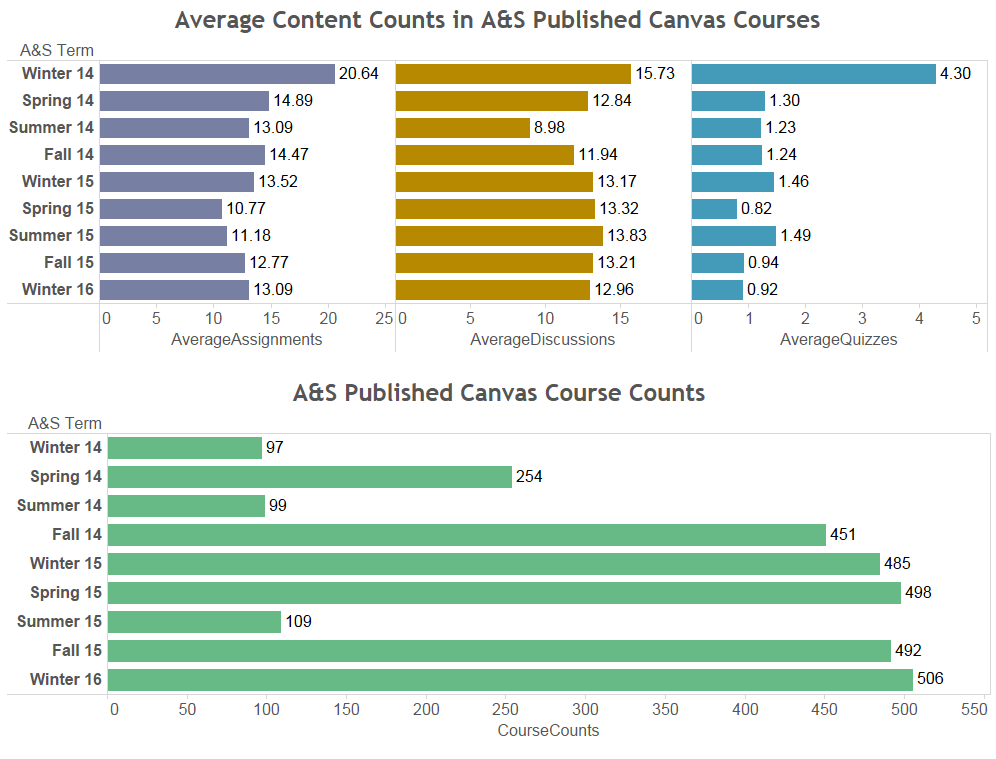
Changes in Canvas course content over terms

Average counts of course contents (Assignments, Quiz and Discussion) by terms:

CourseContents

The Application of Learning Analytics

Learning Analytics (LA) is a field of research that aims to predict and advise on learning, further to support faculty in identifying students’ learning needs and improve pedagogical strategies (Siemens, 2012; Verbert, Manouselis, Drachsler & Duval, 2012; Greller&Drachsler, 2012).

Verbert and his associates identified six highly interrelated objectives which are relevant in existing learning and knowledge analytics research (Verbert, Manouselis, Drachsler & Duval, 2012):

  • Predicting learner performance and modeling learners
  • Suggesting relevant learning resources
  • Increasing reflection and awareness
  • Enhancing social learning environments
  • Detecting undesirable learner behaviors
  • Detecting affects of learners

The results derived from LA research suggest that the learning data of students enrolled in programs with competence-based model can inform program core curriculum design. Under that assumption, I came up with a framework that illustrates how Learning Analytics can contribute to positive outcomes at the level of individual students, courses and departments.

  • Analyzing students’ data in learning diligence and outcome can hopefully target learners’ meta-cognition, foster awareness and reflection about one’s learning processes.
  • Data analysis from the student level can inform instructors to implemented targeted interventions and enhance their teaching practices (Greller & Drachsler, 2012).
  • Departments/programs can monitor the performance of students regarding retention and achievement in a discipline. Furthermore, they can evaluate course offerings within the discipline and improve outcomes of the programs.

LAFramework

REFERENCE:

Ali L., Hatala M., Gasevis D & Jovanovic J. (2012). Computers & Education, 58 (1), 470-489, Available at http://www.sciencedirect.com/science/journal/03601315/58/1

Greller, W., & Drachsler, H. (2012). Translating Learning into Numbers: A Generic Framework for Learning Analytics. Educational Technology & Society, 15 (3), 42-57.

Siemens, G. (2012). Learning Analytics: Envisioning a Research Discipline and a Domain of Practice. LAK ’12 Proceedings of the 2nd International Conference on Learning Analytics and Knowledge , 4-8. Available at http://dl.acm.org/citation.cfm?id=2330605

Verbert, K., Manouselis, N., Drachsler, H., & Duval, E.(2012). Dataset-Driven Research to Support Learning and Knowledge Analytics. Educational Technology & Society, 15 (3), 133-148.