

Logistic regression method has been commonly used to predict the class of observations, which have only two possible outcome values: 0 or 1, yes or no, based on predictor variables.
The example in this blog is intended to demonstrate how we can employ the method to identify potential indicators and model a binary outcome, which predicts fail or pass for any graded assignments at a given time. For the sake of simplicity, in this blog, we started with the most common data points that can be harnessed from an LMS:
•Submission time – how early or late an assignment was submitted by a given student in relation to the due time of the assignment,
•total activity time – accumulative time spent in a course at a given time,
•total number of page views – accumulative number of clicks on course content, and
•the number of late submissions.
In this demo, student’s current score was converted to a binary value, pass or fail, as the response variable.
Using the logit model
The code below estimates a logistic regression model using the glm (generalized linear model) function in R. Based upon the initial explorations of the sample data, we decided to convert number of late submissions to a factor to indicate that it should be treated as a categorical variable. It should also work if you treat it as a continuous variable.
 glm(formula = score_status ~ submission_duetime_diff + late_submission +
    total_activity_time + page_views, family = "binomial", data = df)
You can also use predicted probabilities to examine the model. Predicted probabilities can be computed for both categorical and continuous predictor variables. It is always helpful to use graphs of predicted probabilities to present the model. Below is a plot with the predicted probabilities pass or fail against indicator variable colored by late submission status.


Gathering more variables and repeating the process
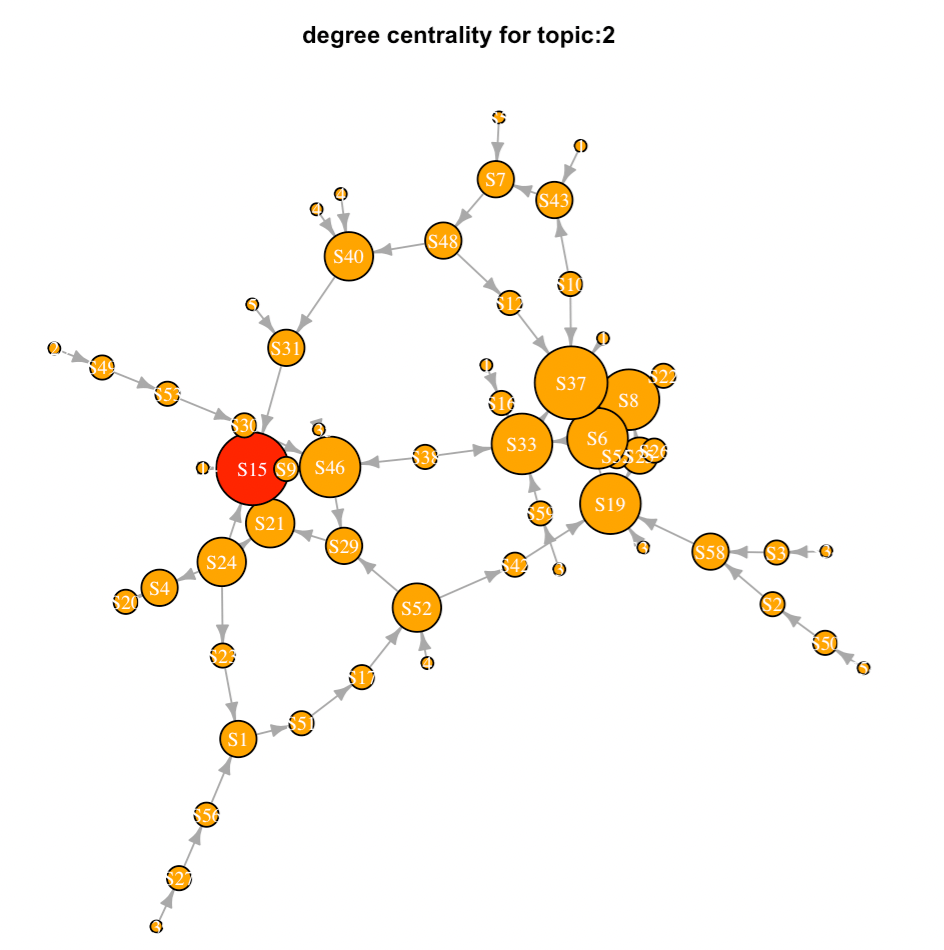
Once you get a prototype working, you can then add more variables, such as discussion participation and content access. In this demo, we used degree centrality to generate a score for an individual learner based upon their discussion interaction activities. We quantified the content access by summing the total clicks on each content category, i.e., files, assignments, modules, discussions.
Displaying the predictive outcome in a meaningful layout
After all, the statistical analyses is to provide instructors with a visualization that presents the results in an user-friendly digestible format, which helps them make an informed decision to reach out to the student who was identified as an individual-may-need-help.

Resources: https://stats.oarc.ucla.edu/r/dae/logit-regression/